What is overdispersion?
/A luminescence age from a sample is typically calculated from a distribution of ages measured from multiple individual grains or multi-grain aliquots from that sample.
The overdispersion of the De distribution (commonly abbreviated “OD” or “σ”) represents the “spread” in the distribution that remains after all measurement errors specific to each grain/aliquot (also known as the “within-aliquot variation”) have been taken into account (Galbraith and Roberts, 2012). Below, we show an example of a sample with low OD, and a sample with high OD.
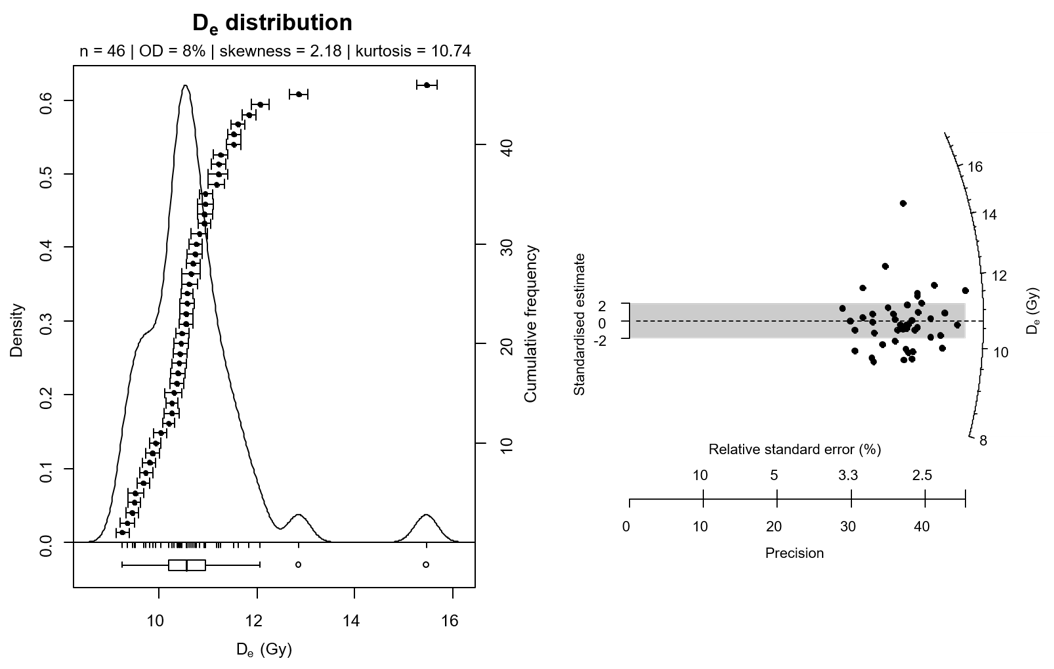
A De distribution, exhibiting a relatively low (<10%) OD, plotted as a kernel density estimate (KDE) (LEFT) and a radial plot (RIGHT). Two high outlying De values suggest that some grains may contain a residual signal prior to burial, however the low OD value, and symmetrical shape of the De distribution between ~3 and ~12 Gy suggest that the majority of grains have been well bleached prior to burial and that heterogeneities in the environmental dose rate field at the sample site are minimal. Grey shading in the radial plot marks ±2σ of the Central Age Model De value (10.2 Gy). Note that most grains fall within this shaded region. Click here for details on how to read a radial plot.

A De distribution, exhibiting a high (>30%) OD, plotted in a kernel density estimate (KDE) plot (LEFT) and a radial plot (RIGHT). The asymmetry of the distribution suggests partial bleaching. Grey shading in the radial plot marks ±2σ of the Central Age Model weighted mean De value (27.5 Gy), and the solid line marks the younger Minimum age model De value (19.2 Gy). Note that few grains fall within 2σ of the CAM weighed mean De value. Click here for details on how to read a radial plot.
When σ is non-zero or high, we may infer that:
i) some grains have been insufficiently bleached prior to deposition,
ii) there has been mixing between sedimentary layers of different ages, and/or
iii) there are grain-to-grain variations in environmental dose rate not taken into account in our dose rate estimate.