Sources of error in luminescence dating... Some specifics on the fuzzies...
/When interpreting and evaluating luminescence ages of a landform or archaeological site, it’s important to consider sources of error. The main sources of error include:
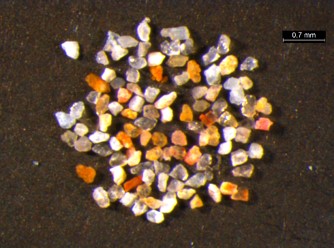
1) Measurements of luminescence signal intensity. In short, the brighter the signal, the lower the error associated with signal intensity (Duller, 2007). Quartz from mountainous regions dominated by granitic rocks commonly has dim signals (Neudorf et al. 2015; 2017), whereas feldspars typically have brighter signals. The intensity of the luminescence signal, also known as “sensitivity”, is thought to be higher in minerals that have experienced multiple episodes of erosion, transport and deposition over time (Fitzsimmons et al., 2010; Fitzsimmons, 2011; King et al., 2011). Australian quartz, derived from ancient mature sandstones, has some of the brightest luminescence signals in the world.
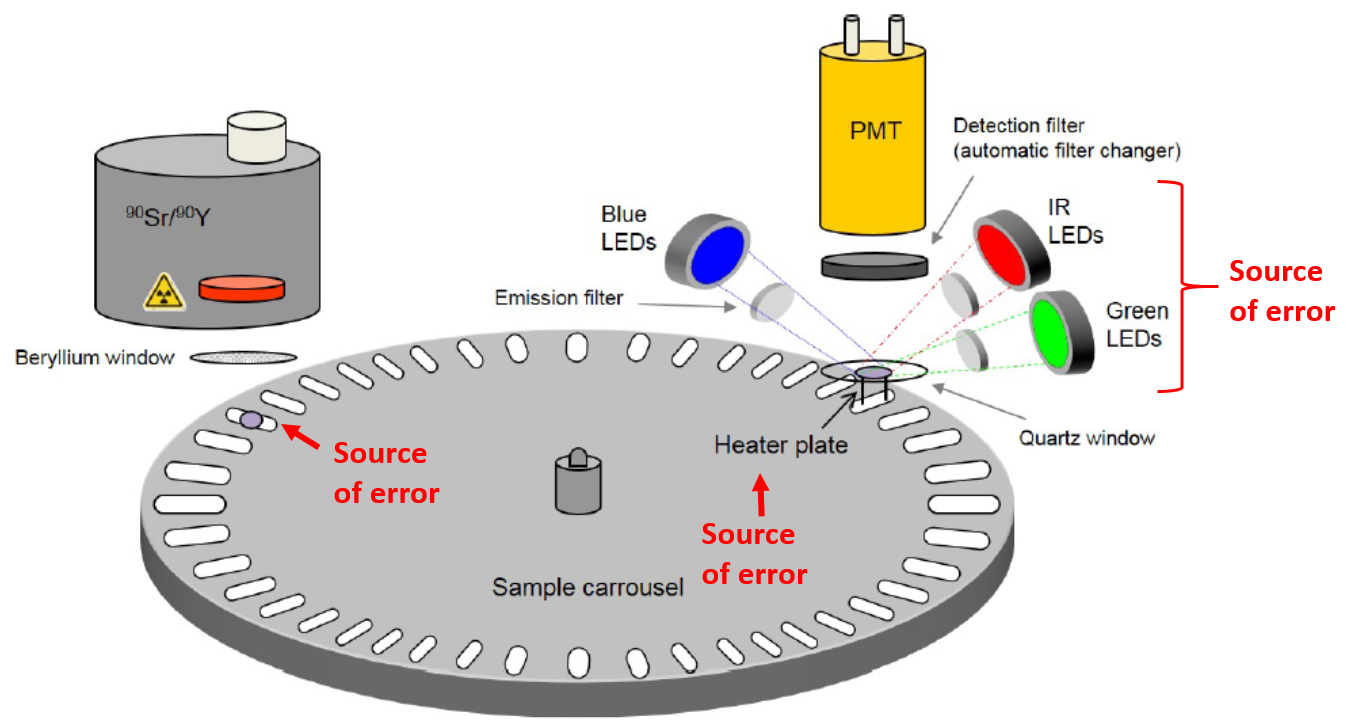
2) Instrumental error associated with the equipment used for De measurement. This error results from variations in aliquot positioning on the reader carousel during heating, radiation and stimulation. It is also derived from small fluctuations in the brightness of the stimulation source. Instrumental error varies from reader to reader, but commonly equates to ~1-3% (e.g., Armitage et al., 2000; Thomsen et al., 2005; Jacobs et al., 2006b, Rodnight, 2006), and can be measured in the lab.
The components of a luminescence dating reader, modified from Fig. 1.1 of “Guide to The Risø TL/OSL Reader” (July, 2017). Sources of instrumental error include aliquot positioning on the sample carousel and on the heating plate, variations in heating rates, and fluctuations in brightness of the LED or laser stimulation sources.
3) For single-grain measurements on single-grain discs, grain-to-grain variations in administered doses due to a non-uniform radiation field in the luminescence reader. Radiation sources in luminescence readers rarely have a perfectly uniform radation field, but this can be corrected for in the laboratory.
A contour plot of the relative dose rate over a 10 x 10 mm single-grain disc irradiated in a luminescence reader at DRI. Correction factors generated from these data are used to correct single-grain data measured on this machine for non-uniform beta irradiation.
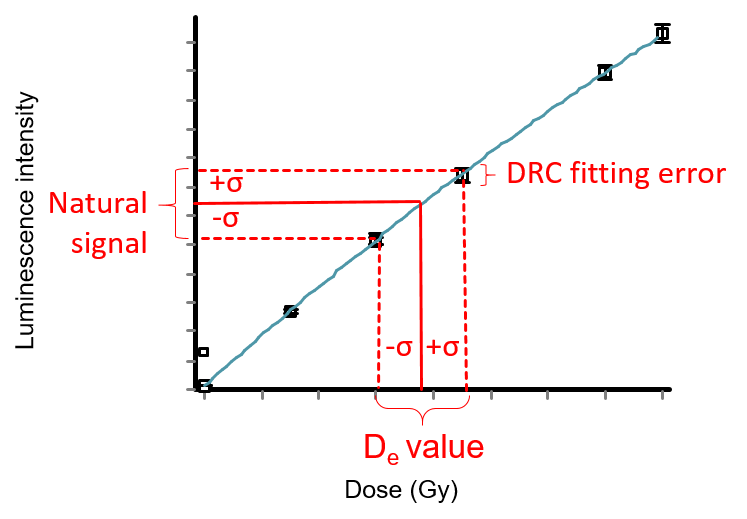
4) Dose response curve (DRC) fitting error. Dose response curves are used to determine a sample’s response to laboratory-given doses (aka regeneration doses) in the lab, in order estimate the true (natural) dose (De) of the sample. Due to instrumental error and error associated with luminescence signal intensity, regeneration dose points will also have error, and these will contribute to the total error associated with fitting the curve to the points (Duller, 2007).
5) Systematic failures in the measurement protocol and/or sediment optical properties that do not work well with the measurement procedure. Grains or multi-grain aliquots that show aberrant behavior are typically rejected from further analysis to reduce this error.
6) Errors associated with dose rate measurement or the measurement of the concentration of radionuclides in the sample burial environment. These errors are dependent on the methods of measurement (e.g., neutron activation analysis, high-resolution gamma spectroscopy, in situ gamma spectroscopy, etc.).
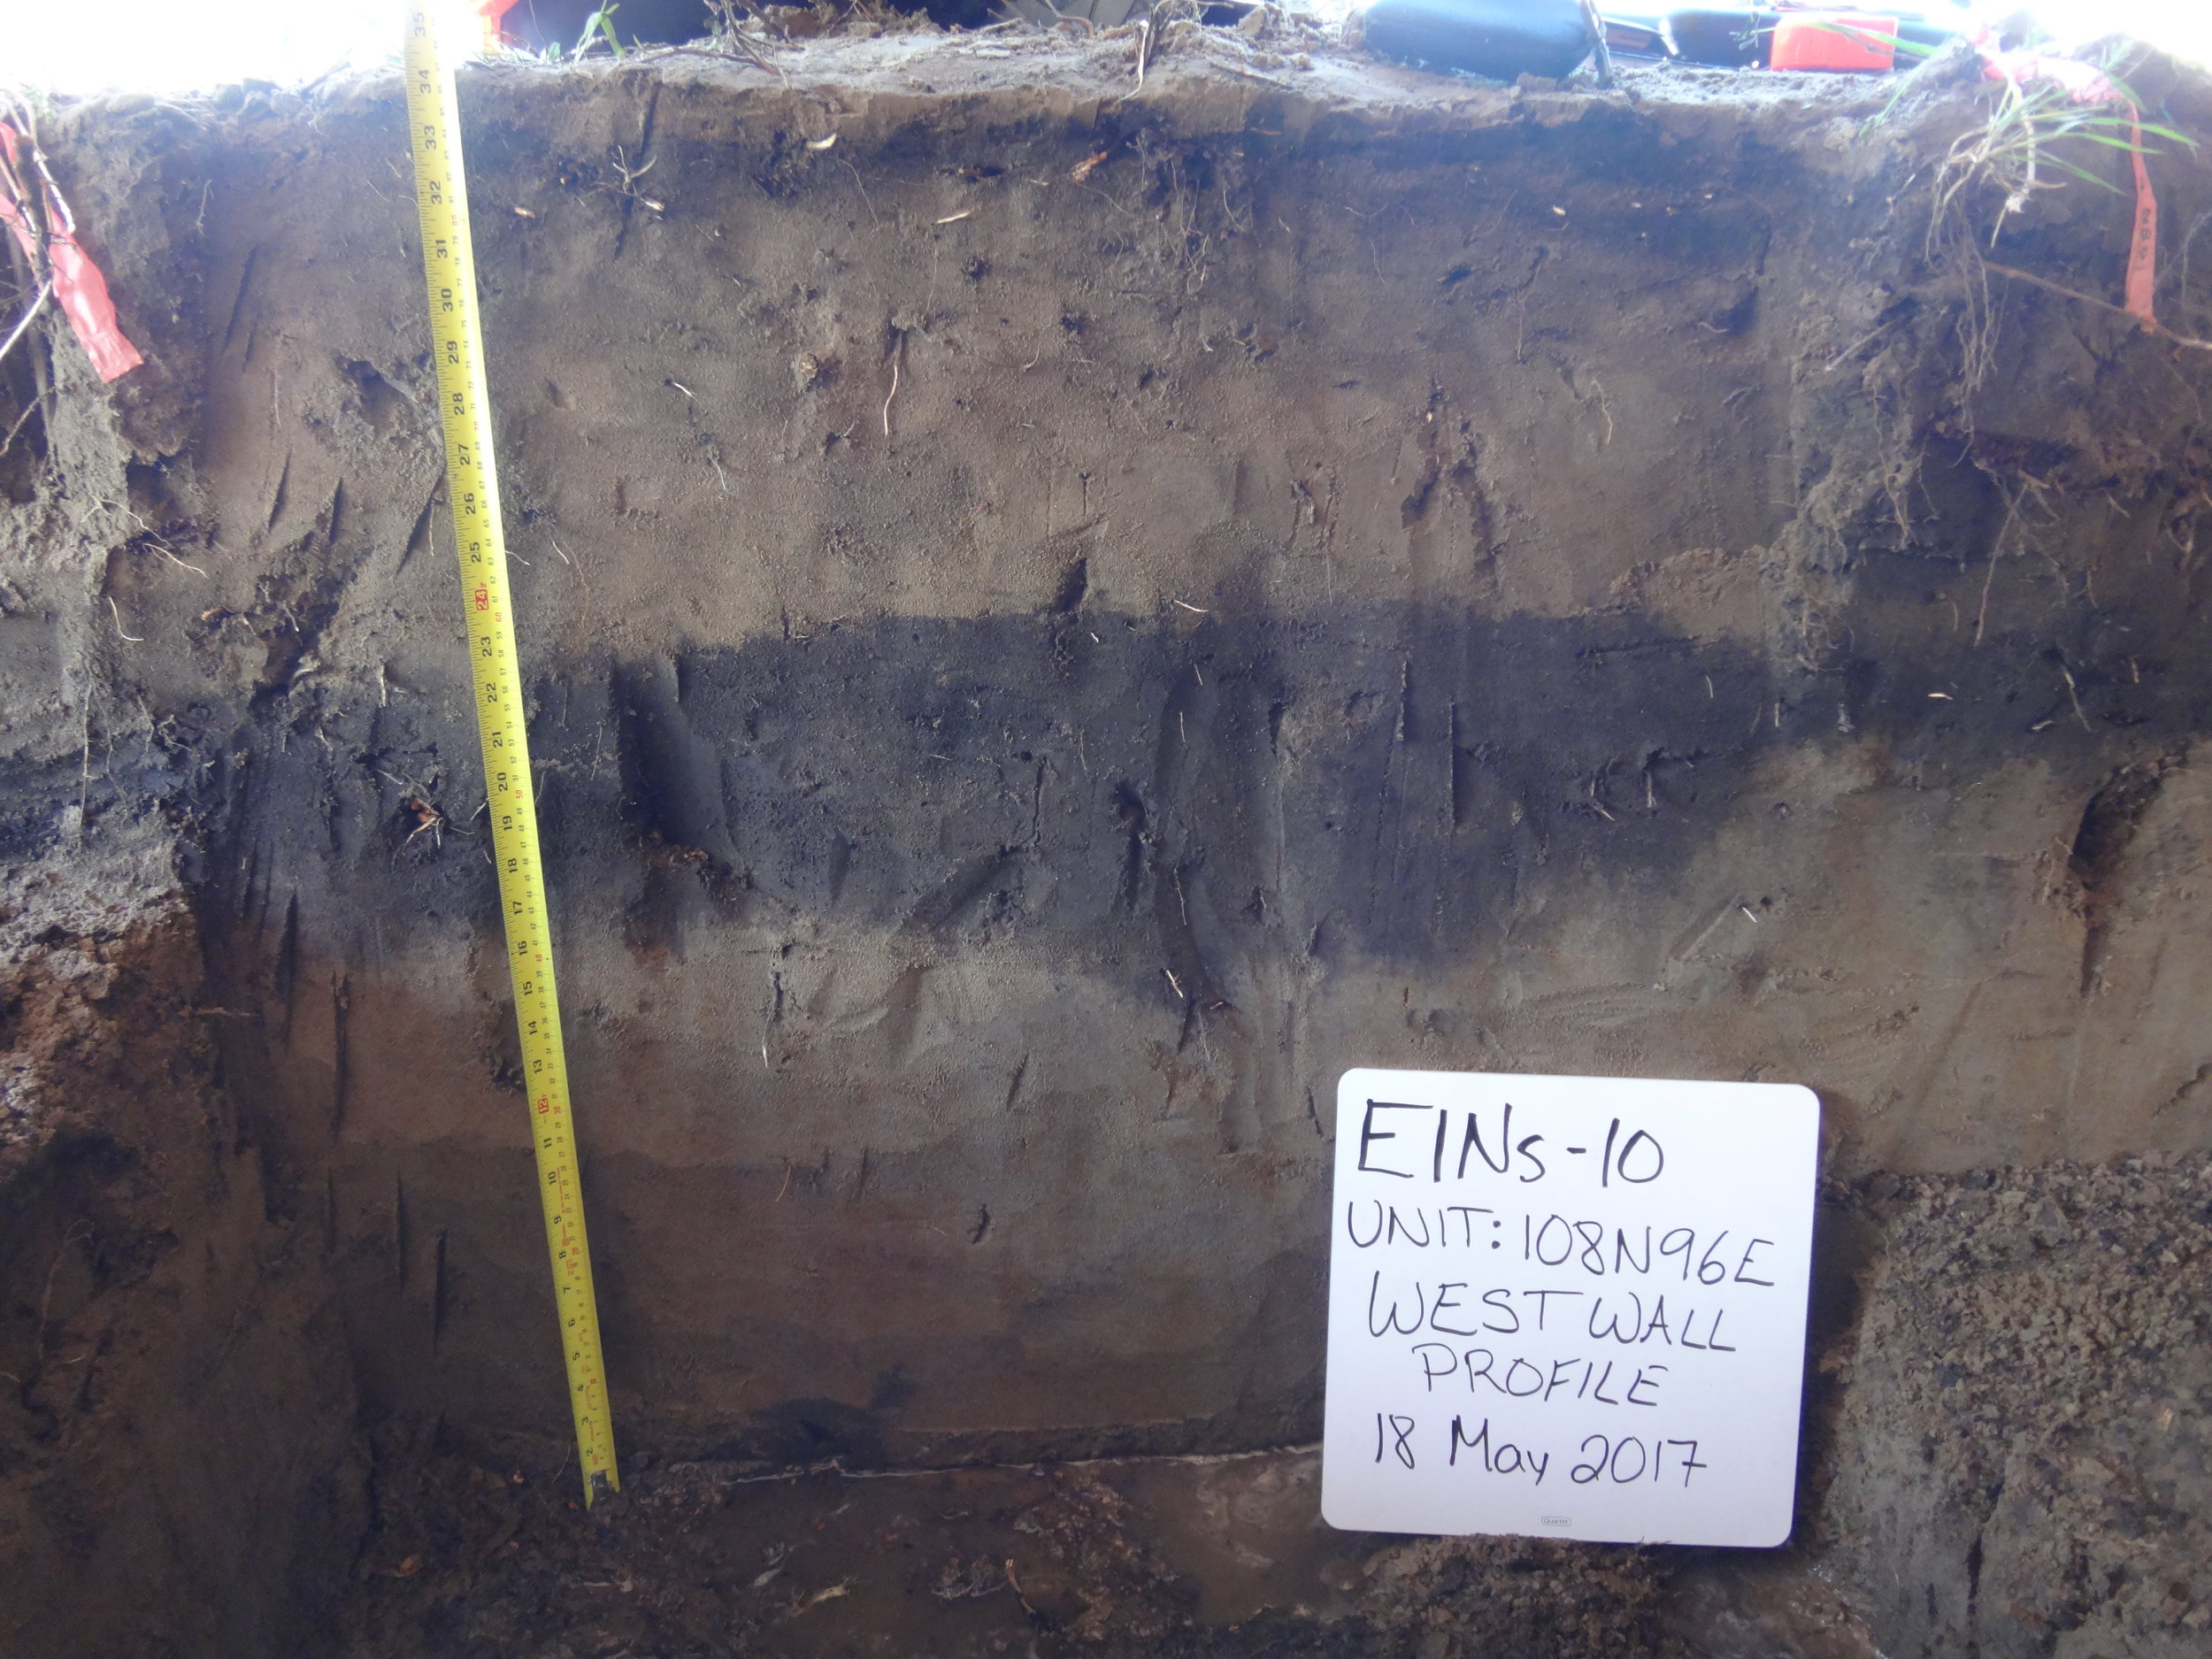
7) Errors that must be approximated subjectively. This often include assumptions regarding the burial environment that effect the rate of radiation the sample has received throughout its burial history. Has the water content fluctuated? Has organic material that uptake radionuclides accumulated or disappeared? Has the sedimentation rate changed? Has pedogenesis altered the sediments? These sources of error are best evaluated when we collect detailed sedimentological and geomorphological observations in the field.
Of course, the precision with which a luminescence age can be measured may not reflect its accuracy. For example, extremely precise De and age estimates can be made on very bright minerals from homogeneous sediments with well defined dose rates. But if the signals of these grains were not completely re-set prior to final deposition, their measured age may be an over-estimate. Seemingly precise luminescence ages may also be inaccurate if the dose rate of the burial environment has changed through time. Thus the error and assumptions associated with all components of a luminescence age need to scrutinized carefully to determine the chronology of a site.


