Single-grain vs multi-grain analysis – which one should I use?
/Luminescence dating measurements can be made on multi-grain aliquots of sand adhered to stainless steel or aluminum discs, or on individual sand grains mounted on single-grain discs with holes of up to 300 µm in diameter. There are two main advantages of single-grain analysis:

A quartz grain (TOP), a quartz multi-grain aliquot (BOTTOM LEFT), and a K-feldspar-rich multi-grain aliquot (BOTTOM RIGHT) extracted from alluvial sand from the Middle Son Valley, Madhya Pradesh, India. Photo credits: Christina Neudorf
1) grains with undesirable luminescence properties can be identified and disregarded from analysis, and
2) the age (or De) distribution shape and structure is easier to visualize when luminescence signals are not comprised of multiple signals from multiple grains.
Grains that should be disregarded from analysis include those with optical properties not suitable for dating, or contaminating grains of a different mineral (feldspar grains in a quartz aliquot, for example). When dating K-feldspar at the single-grain scale, grains that suffer from anomalous fading can also be excluded, so that corrections for this effect do not have to made later.
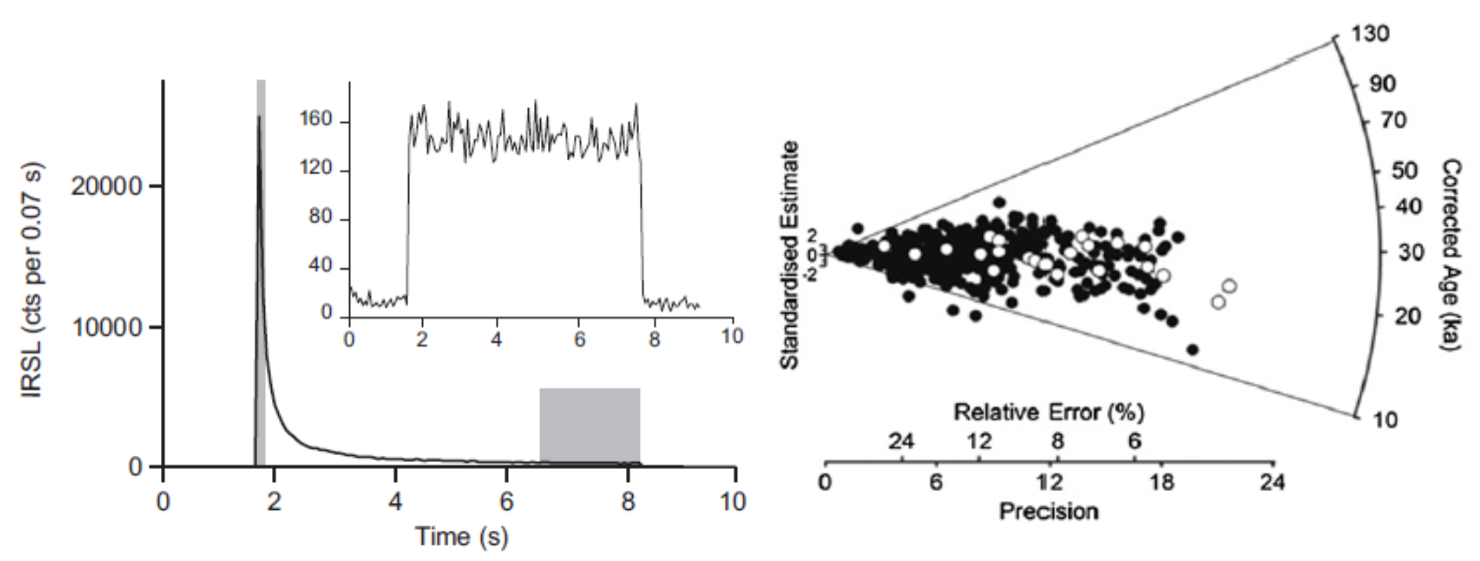
(LEFT) The luminescence signal (measured in photon counts per 0.07 s) from a K-feldspar grain and a contaminating quartz grain (inset) detected through CN 7-59 and BG 39 optical filters (from Neudorf et al. 2012). (RIGHT) A multi-grain K-rich feldspar aliquot age distribution (white symbols) superimposed on a single-grain K-feldspar age distribution (solid symbols) from the same sample (from Neudorf et al. 2012). Note the averaging effect of the multi-grain distribution. Click here for instructions on how to read a radial plot.
Single-grain analysis also allows geochronologists to assess how well a sample has been bleached by the sun prior to burial. In many depositional environments, grain signals may only be partially depleted, or not at all due to turbid subaqueous conditions, or rapid deposition by gravity or water. This can lead to a highly spread or skewed De distribution, where the true age of the deposit must be calculated from the youngest grains only.
In some instances, single grain analysis can also reveal evidence of mixing between two or more deposits of different age. In these cases, statistical models may be applied to help distinguish one component from another.

(TOP LEFT) A highly spread multi-grain K-feldspar aliquot De distribution from partially bleached littoral sands near Great Slave Lake, NWT, Canada (Wolfe et al. 2018). Each aliquot consisted of ~100 grains. (TOP RIGHT) A multi-grain K-feldspar aliquot De distribution from coarse, subaqueous outwash fan deposits in north-central Quebec, Canada (Price et al. unpublished). The small spread suggests that the grain signals were re-set during transport in a shallow, proglacial stream prior to subaqueous deposition. Each aliquot consisted of ~70-100 grains. (BOTTOM LEFT) A multi-grain K-feldspar aliquot age distribution from well-bleached, terraced alluvial sands in the Middle Son Valley, India (Neudorf et al. 2014). Each aliquot consisted of ~30 grains. (BOTTOM RIGHT) A single grain quartz age distribution from alluvial sands in the Middle Son Valley, India underlying ash from the ~75 ka Toba supervolcanic eruption. The multi-grain K-feldspar aliquot age distribution (~30 grains per aliquot) from the same sample is shown as white triangles. Three solid lines mark the ages of three statistically significant components that may represent different aged sedimentary units that have been mixed during mass wasting and fluvial processes (Neudorf et al. 2014). Click here for instructions on how to read a radial plot
Of course, single-grain dating does have its disadvantages – first, measurements are much more time consuming, and second, measurement errors from individual grains tend to be higher than those from aliquots. If the sample of interest is derived from a depositional environment where partial bleaching is unlikely (sand dunes, for instance), it may be more time and cost efficient to measure multi-grain aliquots.