How to read Radial Plots

To obtain a luminescence age, geochronologists must first measure the equivalent dose or De value (an estimate of the amount of radiation absorbed by the sample in its burial environment). In most cases, the De for a sample is calculated from a distribution of De values measured from multiple aliquots or multiple grains from the same sample.

The De distribution allows us to assess a number of things, such as whether all grains have been sufficiently exposed to sunlight prior to the most recent burial event, or whether there has been mixing between two or more sedimentary units of different ages.

A radial plot. 95% of points should fall in grey shaded area if they are consistent with each other at 2 σ. The relative error is equal to the reciprocal of the precision.

A radial plot. 95% of points should fall in grey shaded area if they are consistent with each other at 2 σ. The relative error is equal to the reciprocal of the precision.

We commonly plot the De distribution in a radial plot. This allows us to see the magnitude of each De value as well as its error.

So, why not use a histogram?

A histogram would be appropriate if the De value errors were all the same. As it turns out, the error of a measured De value tends to be dependent on its magnitude, where larger De values have larger error. So De distributions are usually plotted on radial plots with a logarithmic scale on the radial axis. Unlogged scales may only be used on very young or modern samples with near-zero De values, where the dependency between De values and their errors tends to be negligible.

How to read a radial plot (modified from Galbraith and Roberts, 2012). On the left is the 2 sigma error. The width of the bar on the left is controlled by the distribution of De. The bottom scale indicates a measure of the error of each De measureme…

How to read a radial plot (modified from Galbraith and Roberts, 2012). On the left is the 2 sigma error. The width of the bar on the left is controlled by the distribution of De. The bottom scale indicates a measure of the error of each De measurement. The relative error and precision of each point (De value) can be read off of the bottom scale that is plotted on a regular orthogonal x,y coordinate system. The De value of each point can be read off of the radial axis on the right. The measured burial dose that is modeled from the population of De values is also typically plotted.

Recently scholars have argued for the use of a so-called “Abanico plot”. These plots combine the radial plot with a histogram or other univariate plot type, such as a kernel density estimate. An example of this type of plot is shown below for a De distribution with low-precision (<5) values and a small cluster of points below the mean (Component 2). Note that the two clusters are visible in the radial plot and kernel density estimate (blue), but become masked in the histogram (black).

A De distribution containing low-precision values and two components plotted in an Abanico plot. See Dietz et al. (2016) for more details on abanico plots and Galbraith and Roberts (2012) for more indepth discussion on radial plots, kernel density e…

A De distribution containing low-precision values and two components plotted in an Abanico plot. See Dietz et al. (2016) for more details on abanico plots and Galbraith and Roberts (2012) for more indepth discussion on radial plots, kernel density estimates and other data visualization strategies.

Paleodose and equivalent dose… what’s the difference?

In the scientific literature, OSL geochronologists commonly report an “equivalent dose” with units of Gray (also known as the De value) as well as an age for a sample. So, if we need to know the “paleodose” of a sample to calculate its age, what is this “De value” all about?

The equivalent dose (or De value) is obtained through experimentation in the laboratory and is simply our attempt at estimating the true paleodose. We say “estimating” because the accuracy of our De value depends entirely on the robustness of our laboratory procedures and the luminescence characteristics of our sample. This is one reason that independent age control is important to verify ages in any geochronologic approach.

A comparison between radiocarbon and luminescence (IRSL) ages from peat and beach sand, respectively on Calvert Island, BC, Canada. Photo credit: Christina Neudorf.

A comparison between radiocarbon and luminescence (IRSL) ages from peat and beach sand, respectively on Calvert Island, BC, Canada. Photo credit: Christina Neudorf.

There are several ways to measure the De value of a sample, but all methods involve measuring a samples’ response to radiation treatment in the lab. This requires measuring the luminescence intensity emitted by a sample after it is given a series of known laboratory doses.

Typical “dose response” or “regeneration curve”. The natural signal is shown as a small box on the y-axis. The De value is the corresponding value for the sample’s regeneration curve on the x-axis.

Typical “dose response” or “regeneration curve”. The natural signal is shown as a small box on the y-axis. The De value is the corresponding value for the sample’s regeneration curve on the x-axis.

OSL geochronologists plot a samples’ response to dose in a “dose response curve” or “regeneration curve”. We then measure the intensity of “natural signal” of the sample (i.e. the signal received in nature and obtained before the sample has received any kind of laboratory treatment). Where the natural signal falls on the dose response curve determines the value of the De. This is essentially a calibration method completed for each aliquot measurement. Multiple measurements of De are combined through statistical techniques to model the final paleodose value that is used in age calculation.

—Christina Neudorf

Quartz or Feldspar? Which mineral should I date?

Both quartz and feldspar are commonly used for luminescence dating. Which mineral is dated depends on its abundance in the sample, as well as its luminescence characteristics. Feldspar exists as a range of mineral species, but the one most commonly used in luminescence studies is potassium (K-) feldspar. All types of feldspar typically suffer from a phenomenon called “anomalous fading”, where the signal fades through geological time. The fading rate of each sample can be measured, however, and corrections can be made if the fading rate is not too high. Table 1 below summarizes advantages and disadvantages of both quartz and feldspar. Typically, for new sites, we don’t know which mineral will work better until we prepare and analyze the sample on a luminescence reader.

Table 1. Advantages and disadvantages of dating quartz and feldspar. Modified from Lian (2007).

Table 1. Advantages and disadvantages of dating quartz and feldspar. Modified from Lian (2007).

1. This applies to the most commonly used luminescence signals, blue stimulated luminescence (quartz) and infrared-stimulated luminescence (feldspar). More recent signals (e.g., violet stimulated or thermally-transferred luminescence signals) are be…

1. This applies to the most commonly used luminescence signals, blue stimulated luminescence (quartz) and infrared-stimulated luminescence (feldspar). More recent signals (e.g., violet stimulated or thermally-transferred luminescence signals) are being investigated as means of extending the dating range of luminescence dating techniques.

SHEDDING SOME LIGHT ON LUMINESCENCE DATING

Few have may have heard about luminescence dating despite the fact that it is now used almost routinely in archaeological and paleoclimate studies and can surpass the upper limit of radiocarbon dating by over a hundred thousand years! Over the last 40 years, luminescence dating has become an essential tool for helping us understand the timing of early human dispersal, climate change, sea level change, landscape evolution, and the rate of retreat of the last great ice sheets, among other things. This goal of this blog is to serve as a resource for students, academics, users of luminescence data and others who want to understand luminescence dating techniques and how to interpret luminescence age data.

Feb28-Mar05-09 618.jpg

What is OSL?

Optically stimulated luminescence dating

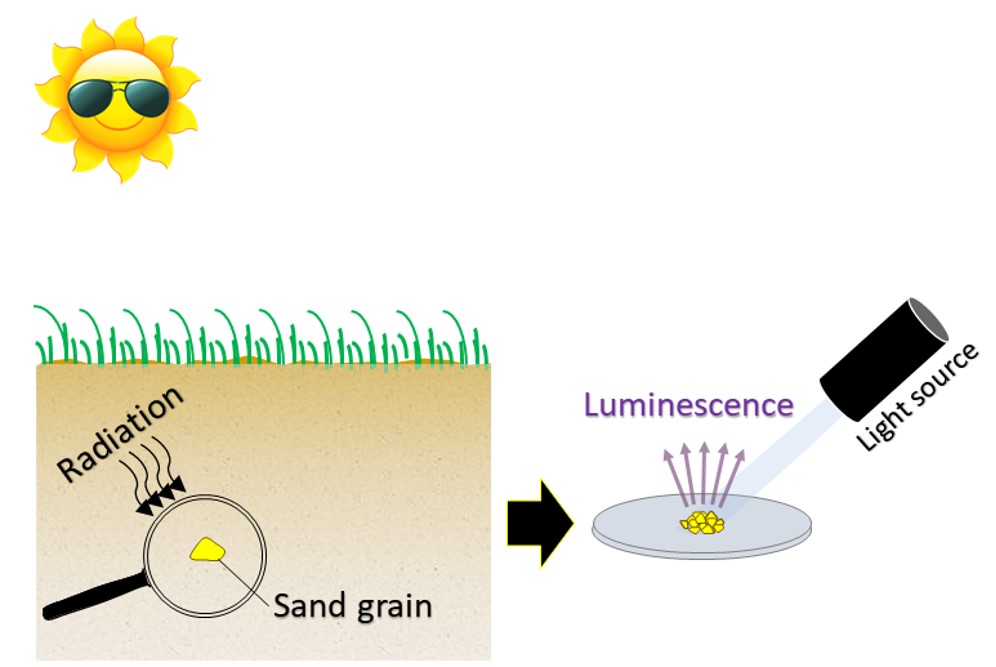
Optically stimulated luminescence broadly refers to a myriad of techniques that are used to determine that last time minerals (typically quartz or feldspar) were exposed to sunlight or heat. In the case of sunlight, luminescence ages tell us the approximate time a deposit or artifact was buried. After quartz and feldspar minerals are buried, they are exposed to ionizing radiation emitted from the surrounding sediments and cosmic rays from outer space that penetrate the ground surface.  At the molecular scale, this radiation re-mobilizes electrons, which in turn accumulate within defects (so-called “traps”) inside the crystal lattice. These defects exist in the form of structural imperfections or impurities. The longer the mineral is buried, the more electrons accumulate within the traps.

hourglass2.jpg

How do we obtain an OSL age?

To calculate an age, we need to define:

1)     the amount of radiation absorbed by the mineral during burial (also called the paleodose), and

2)     the rate at which the mineral was irradiated during burial (called the environmental dose rate).

The age is calculated as the paleodose divided by the environmental dose rate.

burial.jpg

To estimate the paleodose, the mineral is stimulated with a light source in the lab (blue or green light in the case of quartz), which evicts the electrons from their traps and results in the emission of photons of light (luminescence). The luminescence intensity (total photon counts) is measured by a photomultiplier tube and provides an estimate of the amount of radiation absorbed by the mineral during burial.

To measure the environmental dose rate, the quantity of radionuclides in the surrounding sediments are either measured directly, or estimated using radiation detectors in the field or in the lab.

Luminescence dating techniques are used to determine the age of artifacts, landforms and sediments that are as young as a few decades, to as old as ~ 1 Ma. This allows us to refine our understanding of Earth and human history during the Pleistocene and Holocene epochs.

Neolithic stone tools excavated from the Middle Son Valley, Madhya Pradesh, India, 2009. Photo credit: Christina Neudorf.

Neolithic stone tools excavated from the Middle Son Valley, Madhya Pradesh, India, 2009. Photo credit: Christina Neudorf.

The following blog posts will shed some light on the physics of luminescence dating, clarify commonly misunderstood concepts, provide guidance on how interpret luminescence dating data, include some handy tips for sampling in the field, and some links for further reading.

—Christina Neudorf