Sampling for luminescence dating – Part III
/When sampling for luminescence dating, it is important to collect samples for water content measurement, as well as for optical and dose rate measurements. Water content (typically reported as a percentage of a mass of dry sediment) is determined for the sediments collected at the sampling site to help “guestimate” how moist a sample was over its entire burial history. (And yes, we do mean “guestimate”…)
So, why do we care?
Water absorbs radiation emitted from sediments at sample site. This means that if sediments were wet during their entire burial history, they will have lower environmental dose rates than those that were dry (all other factors being equal). So if we assume a sample has been dry, when in fact it was wet, our calculated age will be an underestimate.
Ironically, the moisture history of a sample is not only one of the largest controlling factors on its environmental dose rate, it is also the most difficult to determine. It is usually derived from measured sample water contents in the laboratory, as well as the climatic and geomorphic context of the site. Was the sample taken from a river terrace, alluvial fan, or some other landform that was inundated by a river in the past? Was the sample taken at a depth close to, or below the water table? Has the water table risen or dropped through time? All of these factors should be considered, and appropriate (i.e. large) error should be applied to any water content value to account for these uncertainties.

(LEFT) Calculated age vs estimated water content for two dune samples from Tasmania (Neudorf et al., 2019). These sediments become saturated at a water content of ~20% (blue shaded region), and measured water contents of collected samples were 15 ± 3% (grey shaded region). The age estimate of the young sample (W4014) ranges from ~16 ka to ~19 ka, while the age estimate of the older sample (SB7) ranges from ~175 ka to ~210 ka – a difference of ~35 ka! (RIGHT) The change in absolute age with water content decreases as the age of a sample decreases. For instance, if we recalculate the ages of sample W4014 assuming this sample De value is only ¼ of its true value, then a 20% increase in assumed water content will increase the age by less than 1000 years.

The influence of water content on alpha, beta, gamma and total environmental dose rates at the site of sample W4014 (Neudorf et al., 2019). Water can absorb all three forms of radiation (alpha, beta and gamma), but it has the largest impact on alpha dose rates. The alpha dose rate error is an order of magnitude larger than the errors of all other dose rates, and have been removed from the graph for clarity.
The influence that water content has on sample age, not only depends on the true age of the sample, but also the mineral and grain size fraction that was dated. Below are some examples.

The influence of water content on a sample age can depend on the grain size used for dating. Thompson et al. (2018) dated sample LED11-210 using both the 4-11 µm (FQ) and 90-180 µm (SA) quartz fractions. Water content has a slightly smaller influence on the larger grain size because i) the coarse quartz grains were treated with HF acid to remove the outer alpha-penetrated rind as is commonly done in coarse grain luminescence dating, and ii) radiation is not attenuated in fine grains as much as it is in coarser grains. The measured water contents include an error of 15% that is not plotted for clarity.
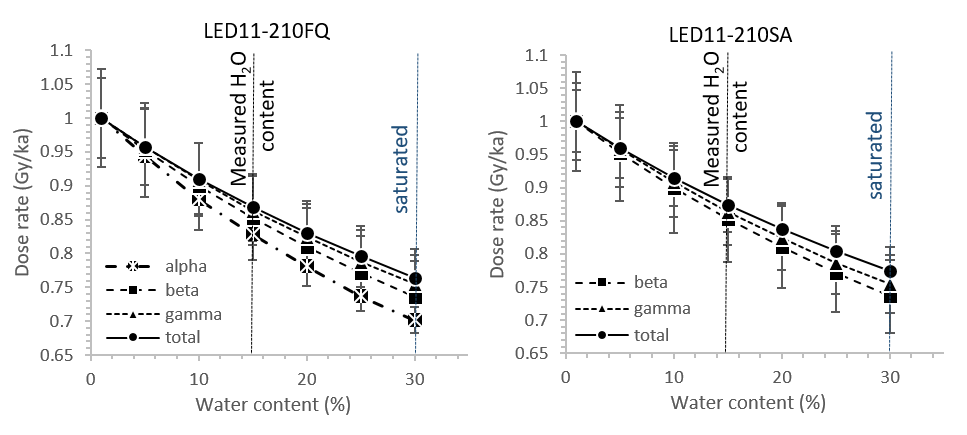
Dose rate (parsed by radiation type) vs water content for the fine grain (LEFT) and coarse grain (RIGHT) samples of Thompson et al. (2018) in the previous figure. The measured water contents include an error of 15% that is not plotted for clarity.

The influence of water content on quartz and feldspar ages measured from the same sample (T4BATT03) (Smedley et al., 2017; 2019). Water content has a slightly larger influence on age estimates from quartz than from feldspar because a proportion of the total dose rate absorbed by feldspar grains comes from K-40 inside the grains. The grey shading covers ±5% error on the water content measurement.

Dose rate (parsed by radiation type) vs water content is plotted for both quartz (LEFT) and feldspar (RIGHT) grains from sample T4BATT03 (previous figure). Again, the alpha contribution can be excluded from the dose rate for the quartz sample, because this sample has been treated with HF acid to remove the alpha-penetrating outer rind. The grey shading covers ±5% error on the water content measurement.