Sampling for luminescence dating – Part II
/Luminescence dating techniques determine the length of time a mineral has been buried by measuring the total radiation dose that mineral has acquired from surrounding sediments and cosmic rays from outer space. So when we collect samples in the field, it’s important to consider where that radiation is coming from, and whether nearby features in the sampling environment may deliver radiation at different rates.
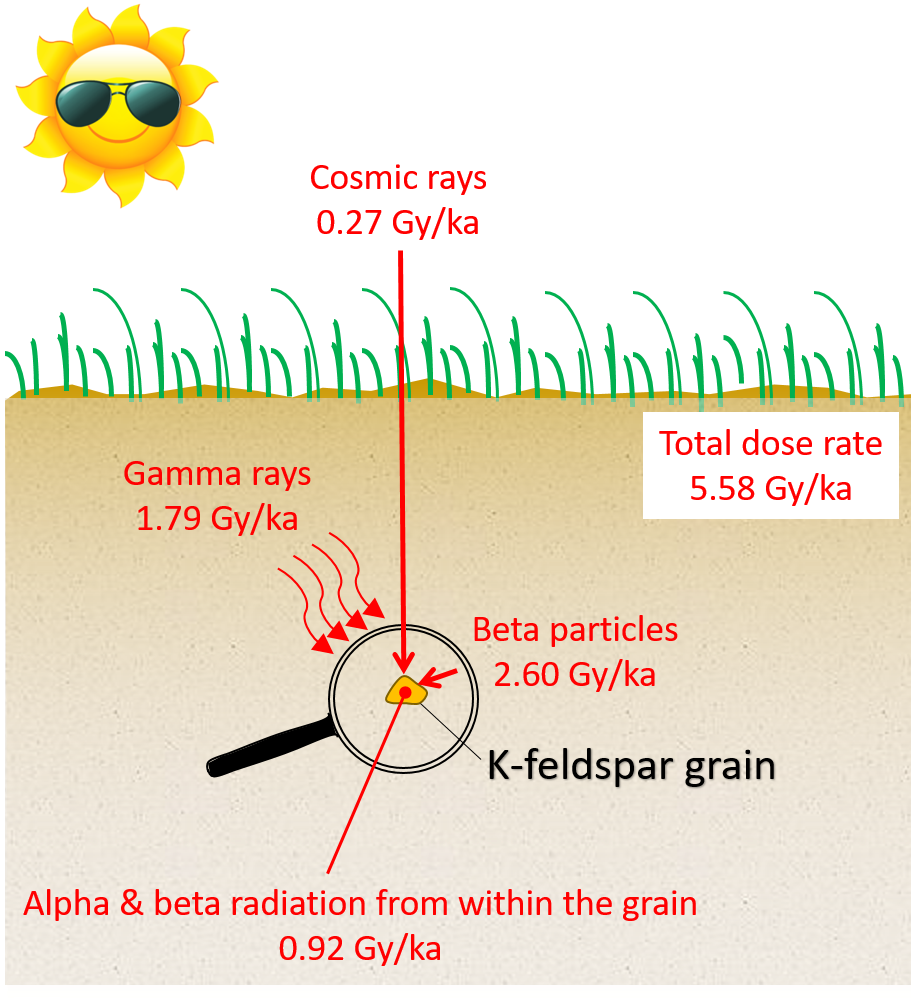
The sources of radiation and their measured dose rates for alluvial sediments (sample DDU011) collected 0.7 m below the surface in the southern Great Basin, USA. Because the grains were etched in HF acid, we can ignore the external alpha contribution to the total dose rate.
Buried minerals absorb radiation from cosmic rays, gamma rays, beta particles and alpha particles, each penetrating the lithosphere to different extents. Cosmic rays can penetrate sediments to several meters and attenuate by ~14% per meter of ~2 g/cm3 sediment. Gamma rays can travel up to 30 cm, beta particles ~3 mm, and alpha particles, the most destructive particles of all, travel only ~25 µm (Aitken, 1998).
A schematic illustrating the sources of radiation in the sampling environment and their approximate travel distances.
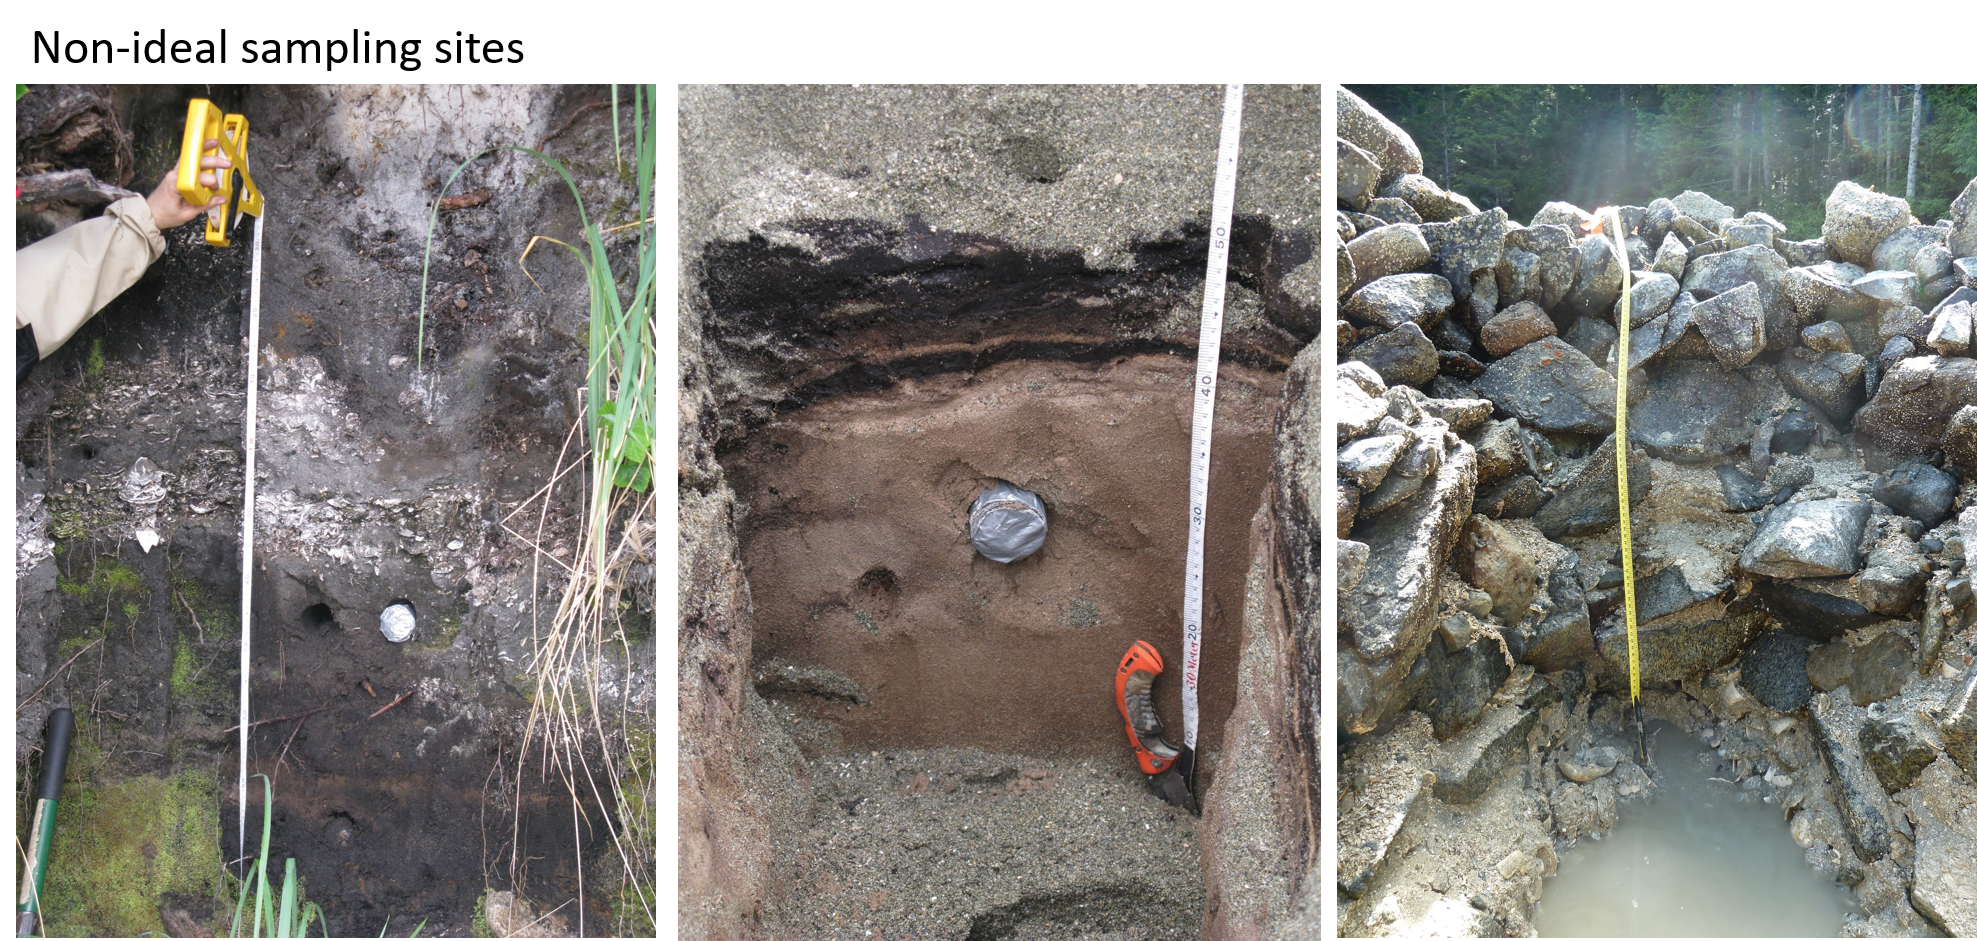
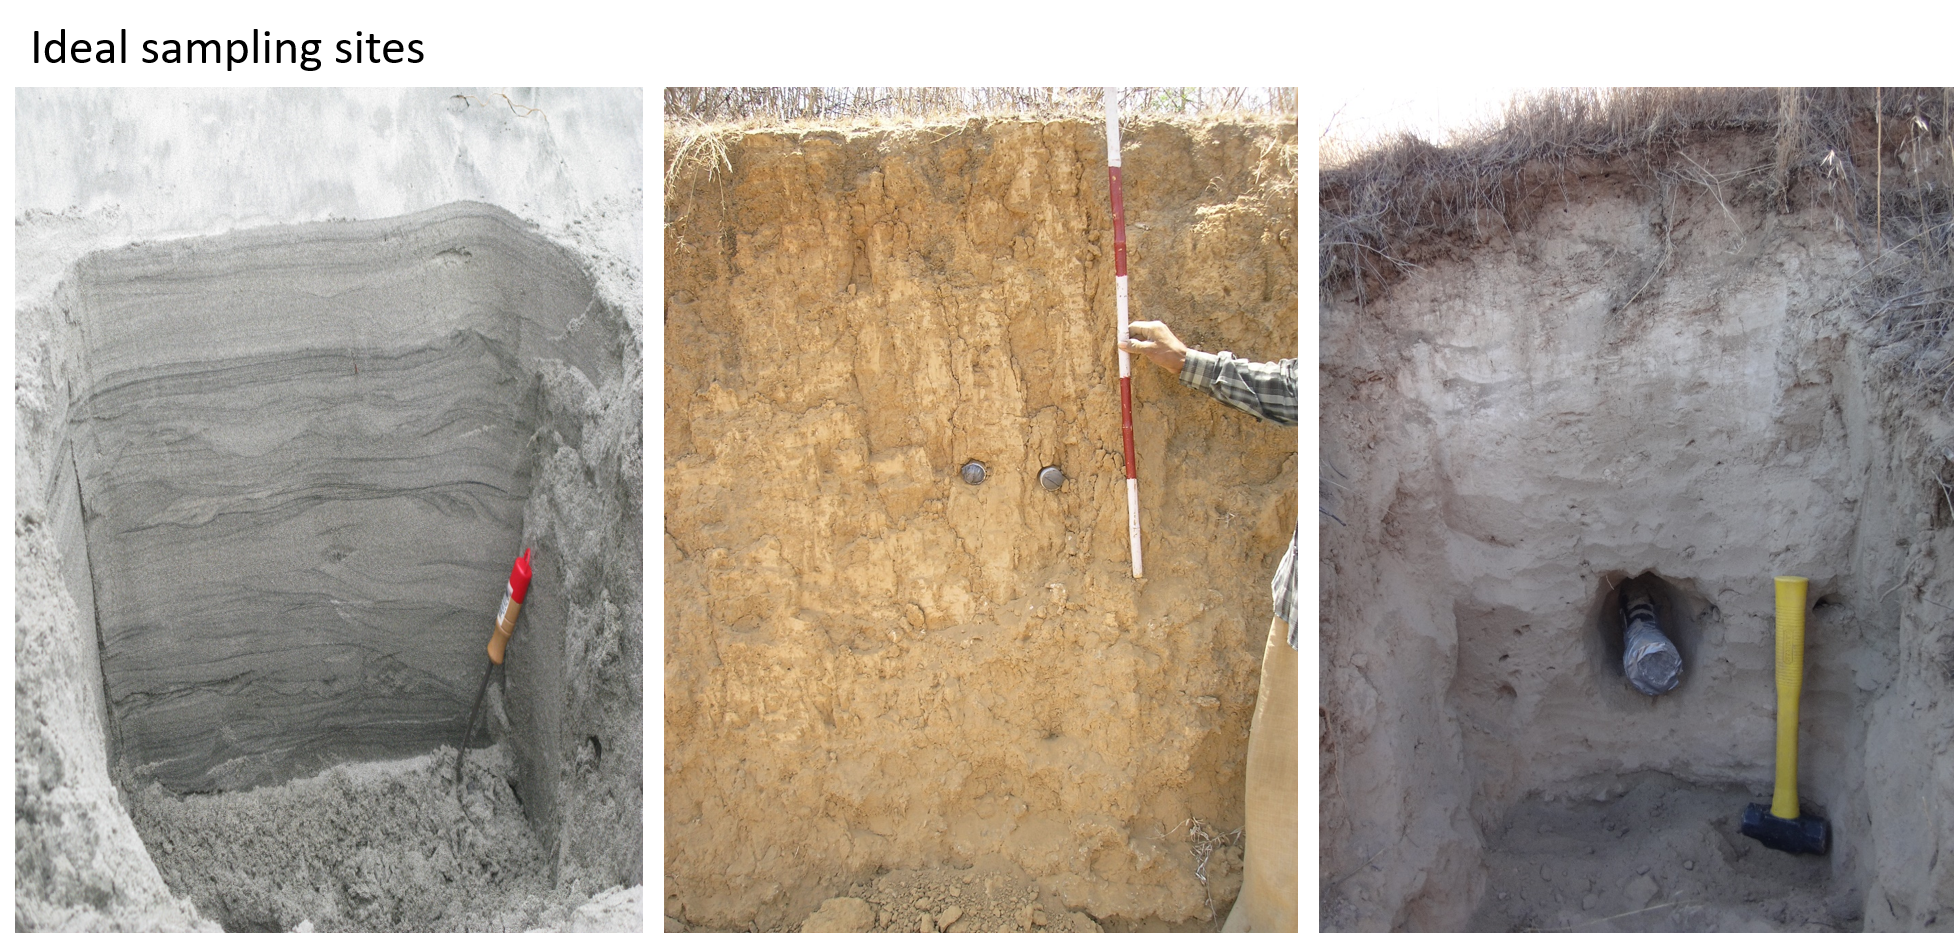
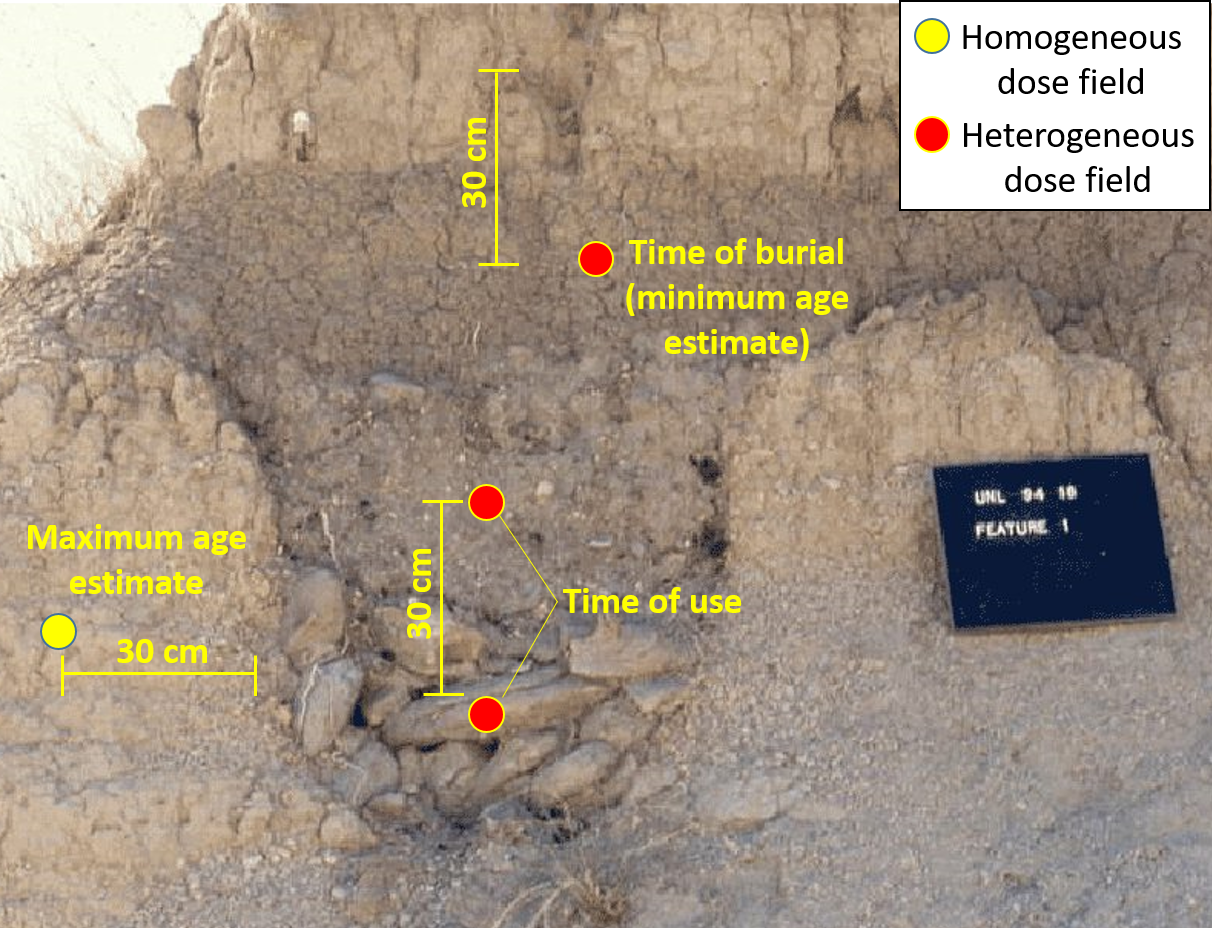
Because the sphere of influence of gamma rays is ~30 cm, we prefer to extract luminescence samples from areas where the composition and granulometry of the surrounding sediments is consistent (or homogeneous) within 30 cm of the sample. If it is not, the dose rate that we measure from the sample may not accurately reflect the dose rate of the surrounding sediments. Examples of ideal and non-ideal sampling sites are shown below.
Often times, especially in archaeology, the feature we’d like to date does not provide a homogeneous dose field for sampling. In these cases, it’s necessary to: i) subsample individual lithostratigraphic layers/features within 30 cm of the sample site individually to estimate their dose rates so that the total dose rate of the sample can be modelled, and/or ii) measure the gamma dose rate to the sample directly in the field using a portable gamma spectrometer.
Possible sample sites (circles) for luminescence dating an earthwork ditch exposed in an archaeological trench at Garden Creek (Wright, 2011, “Earthwork Update” https://gardencreekarchaeology.wordpress.com/page/3/). The yellow circle shows a sample site where the gamma dose rate field is likely to be homogeneous. All other sample sites (red) are located in heterogeneous gamma dose rate fields. The 30 cm scale is hypothetical, and may not be accurate.
Possible sample sites (circles) for luminescence dating an escavated pit hearth in western Nebraska (Photo from the lesson plan by Damita Hiemstra, “Arner Site: Out of the Prairies of Western Nebraska”, http://d1vmz9r13e2j4x.cloudfront.net/nebstudies/Lesson4c_Arner.pdf). The yellow and red circles indicate homogeneous and heterogeneous gamma ray dose fields, respectively. The 30 cm scale is hypothetical, and may not be accurate.
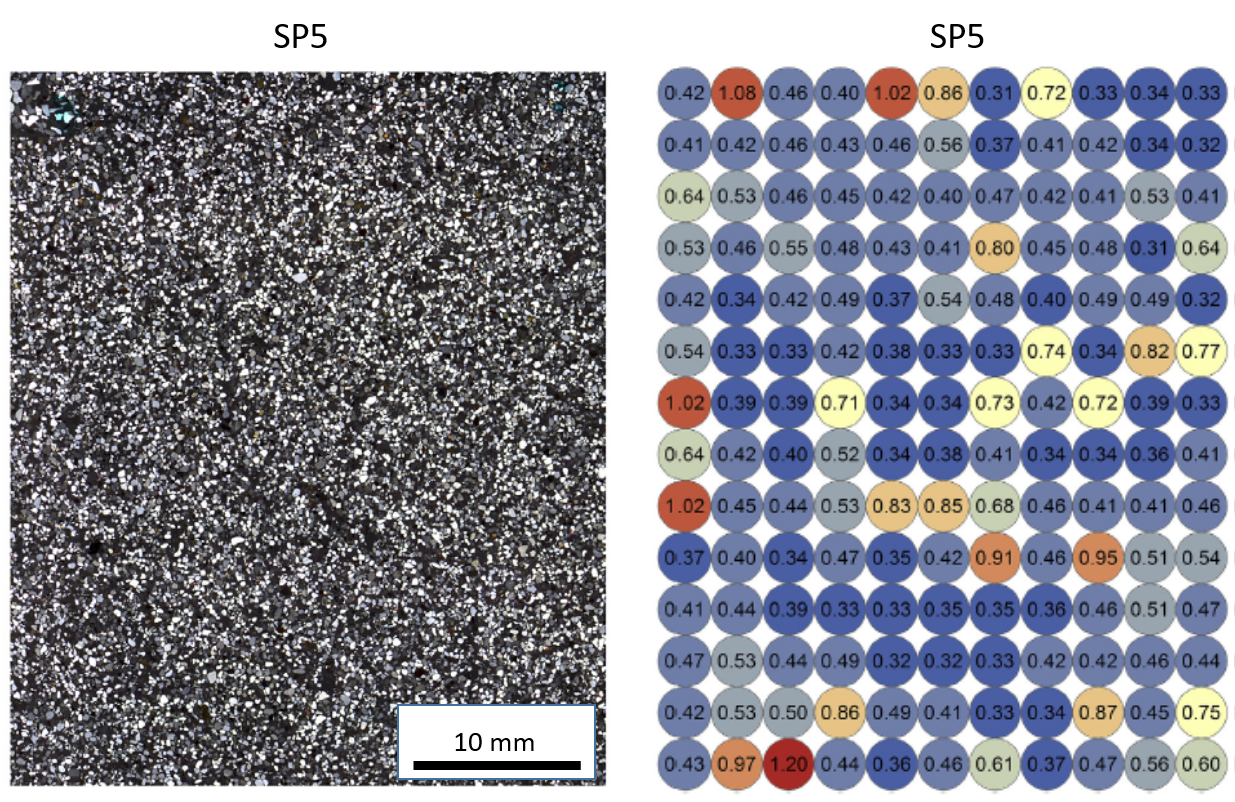
Heterogeneous dose fields are not only possible at the scale of a sedimentary exposure, but also at the scale of a thin section. This microscale heterogeneity is caused by spatial variations in beta dose rates, or “beta microdosimetry”. Spatial variations in K-40 concentrations (e.g., from K-feldspar grains) or U and Th in heavy minerals may lead to beta microdosimetry (e.g., Martin et al., 2015; Jankowski & Jacobs, 2018). This likely contributes to the spread (or overdispersion) of De and age distrubutions from single grains.
A) Stitched microphotograph of a thin section of beach sand from MacCauley’s Beach, NSW, Australia (sample SP5) shown in cross-polarized light. B) A beta dose rate (in Gy/ka) map created from portable XRF measurements of a separate impregnated block of the same sample. The spatial variations in beta dose rate in this sample can explain the spread in De values (overdispersion = 35%) measured from 170 individual grains (Jankowski & Jacobs, 2018).
