Sampling for luminescence dating – Part III

When sampling for luminescence dating, it is important to collect samples for water content measurement, as well as for optical and dose rate measurements. Water content (typically reported as a percentage of a mass of dry sediment) is determined for the sediments collected at the sampling site to help “guestimate” how moist a sample was over its entire burial history. (And yes, we do mean “guestimate”…)

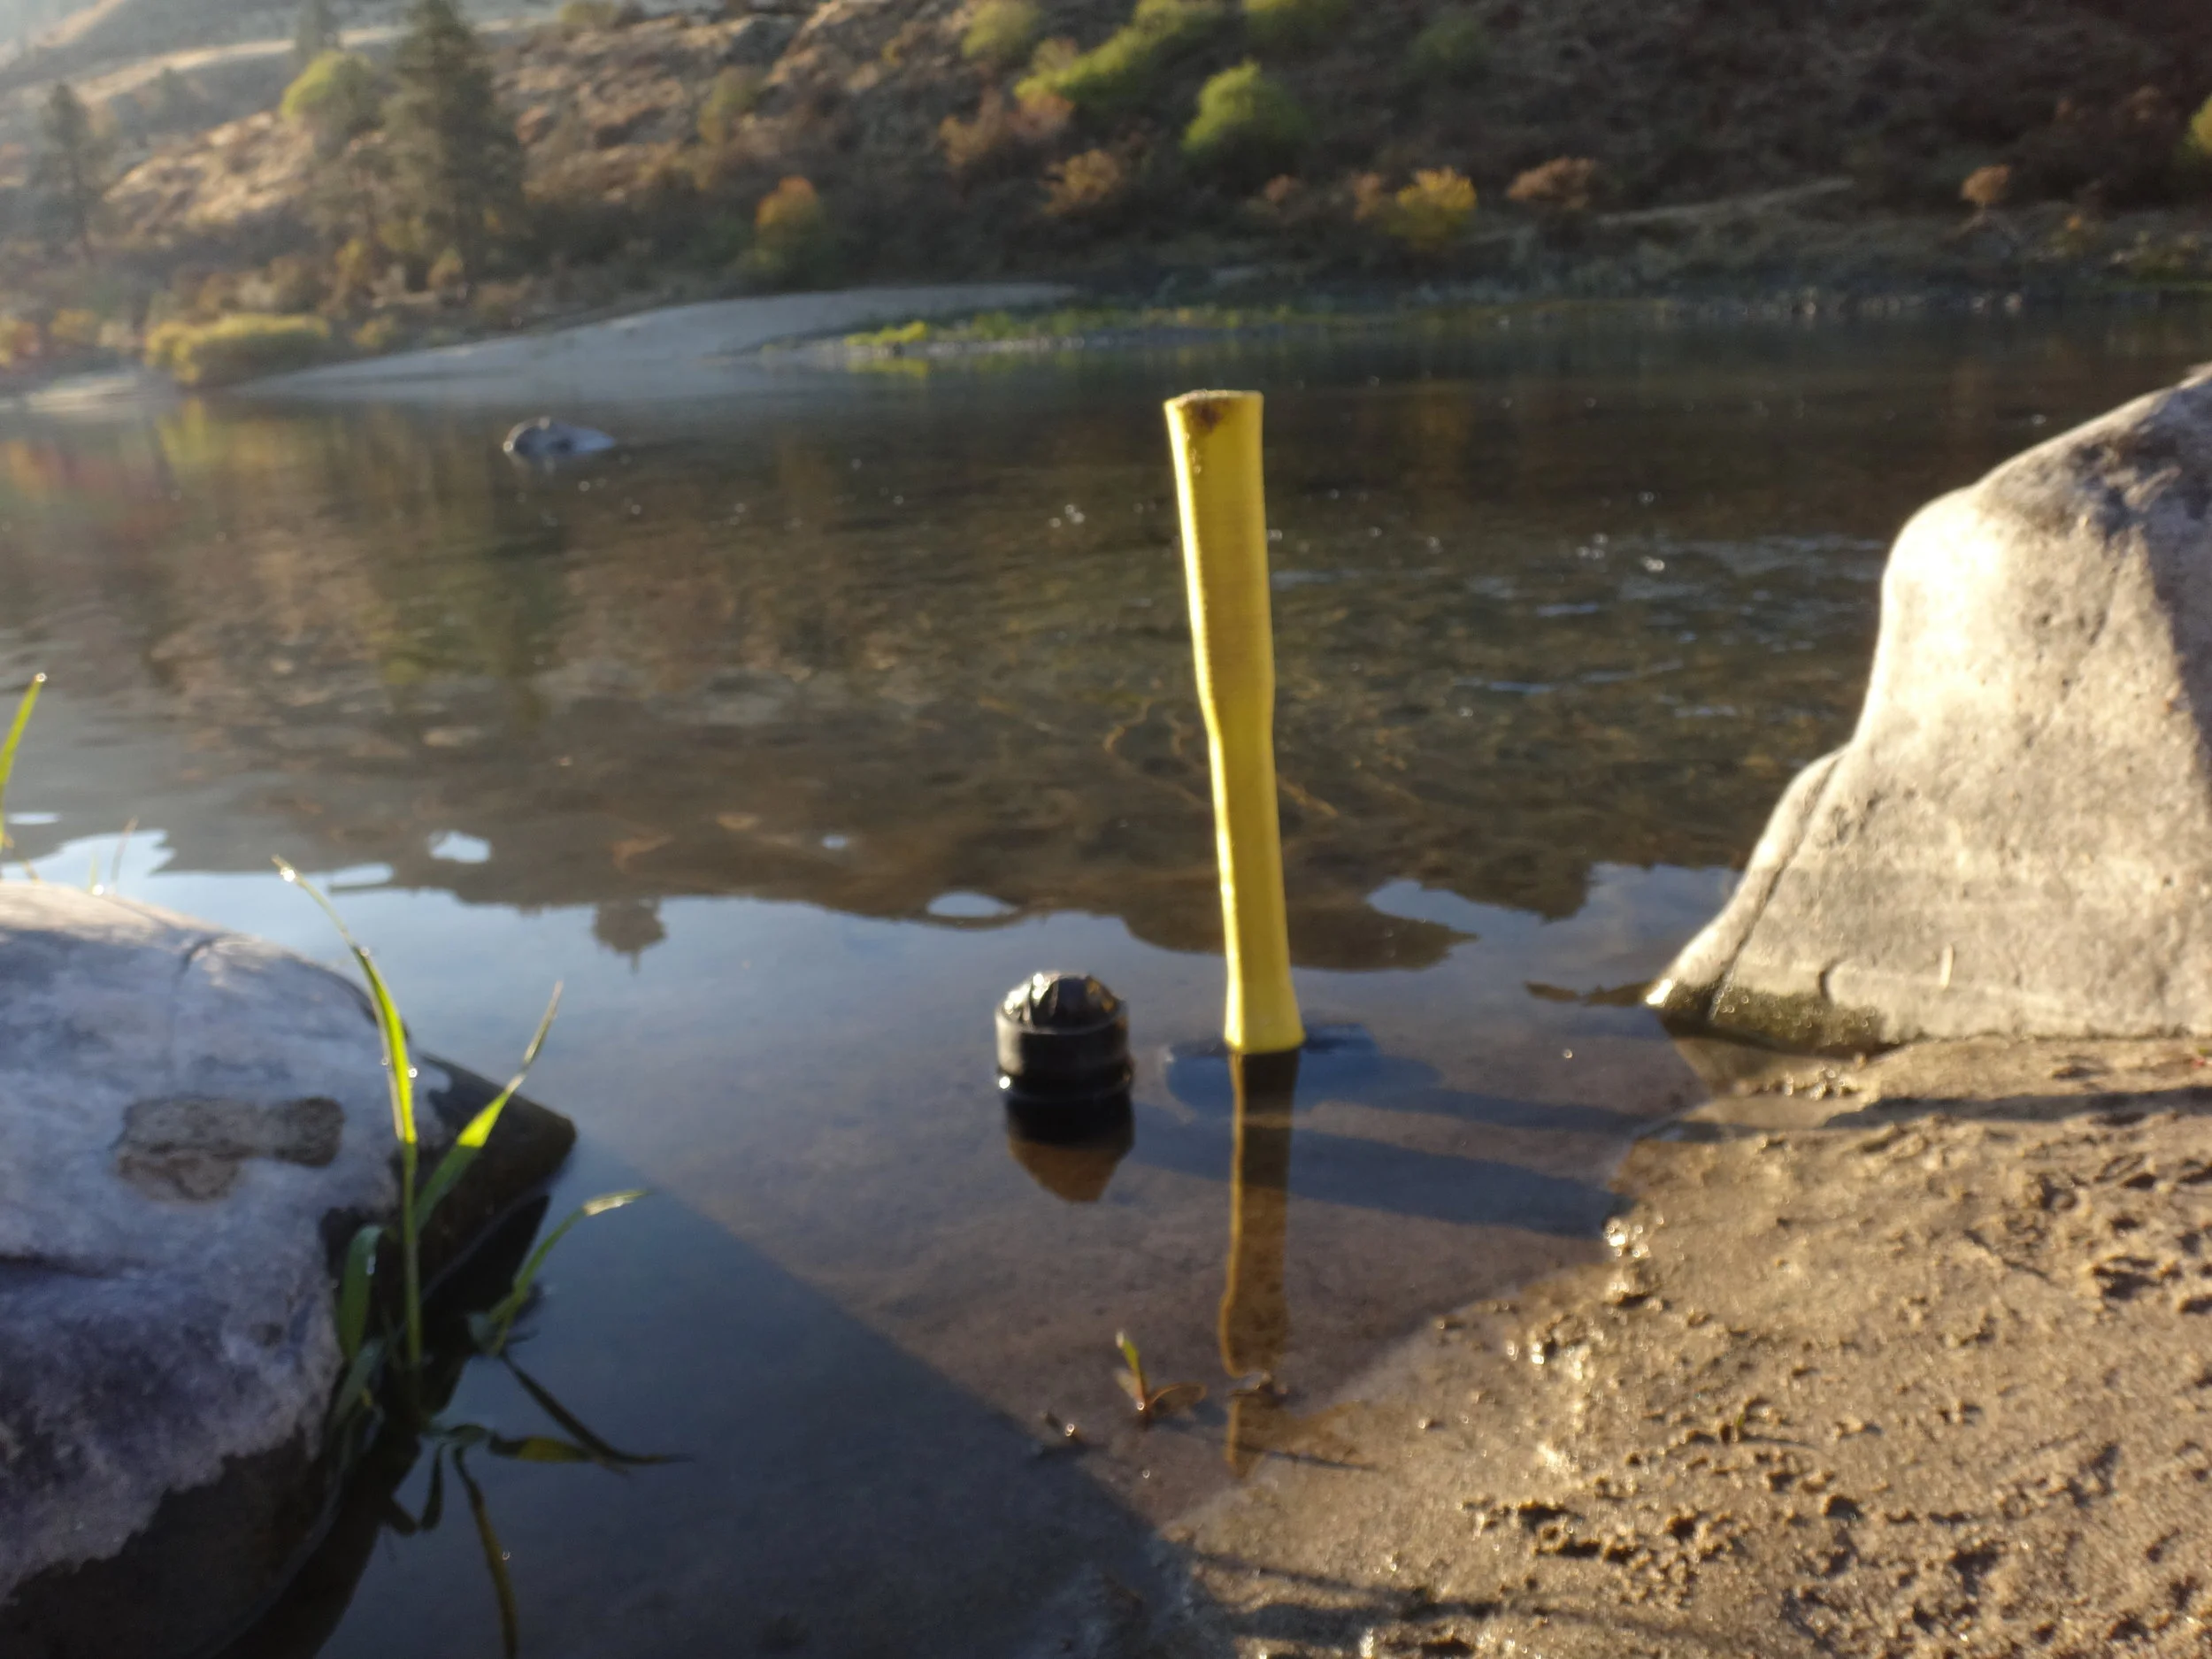
Snake River, ID.JPG

So, why do we care?

Water absorbs radiation emitted from sediments at sample site. This means that if sediments were wet during their entire burial history, they will have lower environmental dose rates than those that were dry (all other factors being equal). So if we assume a sample has been dry, when in fact it was wet, our calculated age will be an underestimate.

subaqueous.JPG

Ironically, the moisture history of a sample is not only one of the largest controlling factors on its environmental dose rate, it is also the most difficult to determine. It is usually derived from measured sample water contents in the laboratory, as well as the climatic and geomorphic context of the site. Was the sample taken from a river terrace, alluvial fan, or some other landform that was inundated by a river in the past? Was the sample taken at a depth close to, or below the water table? Has the water table risen or dropped through time? All of these factors should be considered, and appropriate (i.e. large) error should be applied to any water content value to account for these uncertainties.

(LEFT) Calculated age vs estimated water content for two dune samples from Tasmania (Neudorf et al., 2019). These sediments become saturated at a water content of ~20% (blue shaded region), and measured water contents of collected samples were 15 ± …

(LEFT) Calculated age vs estimated water content for two dune samples from Tasmania (Neudorf et al., 2019). These sediments become saturated at a water content of ~20% (blue shaded region), and measured water contents of collected samples were 15 ± 3% (grey shaded region). The age estimate of the young sample (W4014) ranges from ~16 ka to ~19 ka, while the age estimate of the older sample (SB7) ranges from ~175 ka to ~210 ka – a difference of ~35 ka! (RIGHT) The change in absolute age with water content decreases as the age of a sample decreases. For instance, if we recalculate the ages of sample W4014 assuming this sample De value is only ¼ of its true value, then a 20% increase in assumed water content will increase the age by less than 1000 years.

The influence of water content on alpha, beta, gamma and total environmental dose rates at the site of sample W4014 (Neudorf et al., 2019). Water can absorb all three forms of radiation (alpha, beta and gamma), but it has the largest impact on alpha…

The influence of water content on alpha, beta, gamma and total environmental dose rates at the site of sample W4014 (Neudorf et al., 2019). Water can absorb all three forms of radiation (alpha, beta and gamma), but it has the largest impact on alpha dose rates. The alpha dose rate error is an order of magnitude larger than the errors of all other dose rates, and have been removed from the graph for clarity.

The influence that water content has on sample age, not only depends on the true age of the sample, but also the mineral and grain size fraction that was dated. Below are some examples.

The influence of water content on a sample age can depend on the grain size used for dating. Thompson et al. (2018) dated sample LED11-210 using both the 4-11 µm (FQ) and 90-180 µm (SA) quartz fractions. Water content has a slightly smaller influenc…

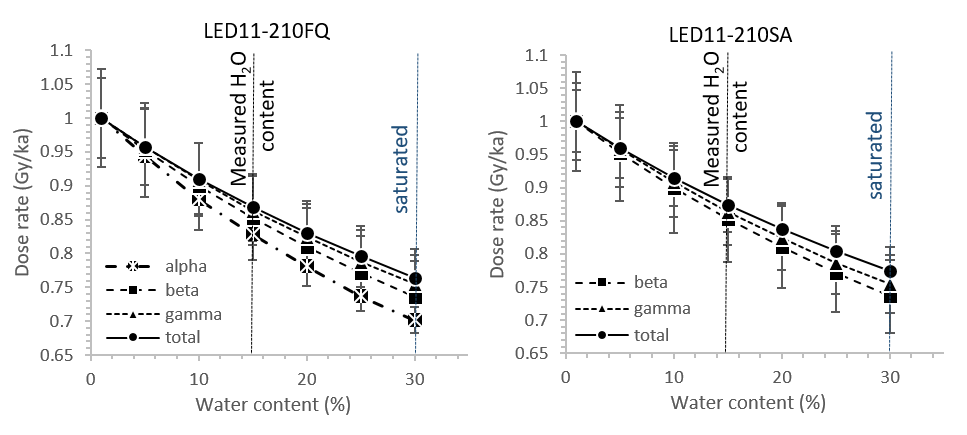
The influence of water content on a sample age can depend on the grain size used for dating. Thompson et al. (2018) dated sample LED11-210 using both the 4-11 µm (FQ) and 90-180 µm (SA) quartz fractions. Water content has a slightly smaller influence on the larger grain size because i) the coarse quartz grains were treated with HF acid to remove the outer alpha-penetrated rind as is commonly done in coarse grain luminescence dating, and ii) radiation is not attenuated in fine grains as much as it is in coarser grains. The measured water contents include an error of 15% that is not plotted for clarity.

Dose rate (parsed by radiation type) vs water content for the fine grain (LEFT) and coarse grain (RIGHT) samples of Thompson et al. (2018) in the previous figure. The measured water contents include an error of 15% that is not plotted for clarity.

Dose rate (parsed by radiation type) vs water content for the fine grain (LEFT) and coarse grain (RIGHT) samples of Thompson et al. (2018) in the previous figure. The measured water contents include an error of 15% that is not plotted for clarity.

The influence of water content on quartz and feldspar ages measured from the same sample (T4BATT03) (Smedley et al., 2017; 2019). Water content has a slightly larger influence on age estimates from quartz than from feldspar because a proportion of t…

The influence of water content on quartz and feldspar ages measured from the same sample (T4BATT03) (Smedley et al., 2017; 2019). Water content has a slightly larger influence on age estimates from quartz than from feldspar because a proportion of the total dose rate absorbed by feldspar grains comes from K-40 inside the grains. The grey shading covers ±5% error on the water content measurement.

Dose rate (parsed by radiation type) vs water content is plotted for both quartz (LEFT) and feldspar (RIGHT) grains from sample T4BATT03 (previous figure). Again, the alpha contribution can be excluded from the dose rate for the quartz sample, becau…

Dose rate (parsed by radiation type) vs water content is plotted for both quartz (LEFT) and feldspar (RIGHT) grains from sample T4BATT03 (previous figure). Again, the alpha contribution can be excluded from the dose rate for the quartz sample, because this sample has been treated with HF acid to remove the alpha-penetrating outer rind. The grey shading covers ±5% error on the water content measurement.
Sampling for luminescence dating – Part II

Luminescence dating techniques determine the length of time a mineral has been buried by measuring the total radiation dose that mineral has acquired from surrounding sediments and cosmic rays from outer space. So when we collect samples in the field, it’s important to consider where that radiation is coming from, and whether nearby features in the sampling environment may deliver radiation at different rates.

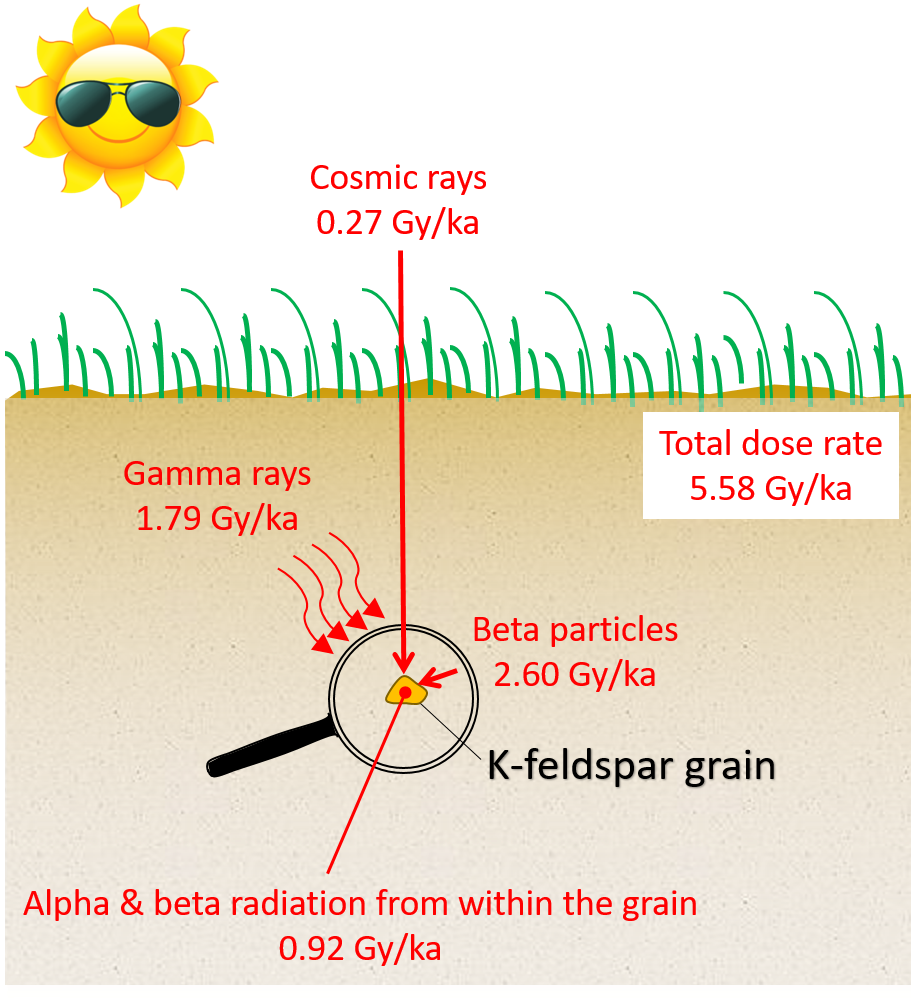
The sources of radiation and their measured dose rates for alluvial sediments (sample DDU011) collected 0.7 m below the surface in the southern Great Basin, USA. Because the grains were etched in HF acid, we can ignore the external alpha contributio…

The sources of radiation and their measured dose rates for alluvial sediments (sample DDU011) collected 0.7 m below the surface in the southern Great Basin, USA. Because the grains were etched in HF acid, we can ignore the external alpha contribution to the total dose rate.

Buried minerals absorb radiation from cosmic rays, gamma rays, beta particles and alpha particles, each penetrating the lithosphere to different extents.  Cosmic rays can penetrate sediments to several meters and attenuate by ~14% per meter of ~2 g/cm3 sediment.  Gamma rays can travel up to 30 cm, beta particles ~3 mm, and alpha particles, the most destructive particles of all, travel only ~25 µm (Aitken, 1998). 

A schematic illustrating the sources of radiation in the sampling environment and their approximate travel distances.

A schematic illustrating the sources of radiation in the sampling environment and their approximate travel distances.

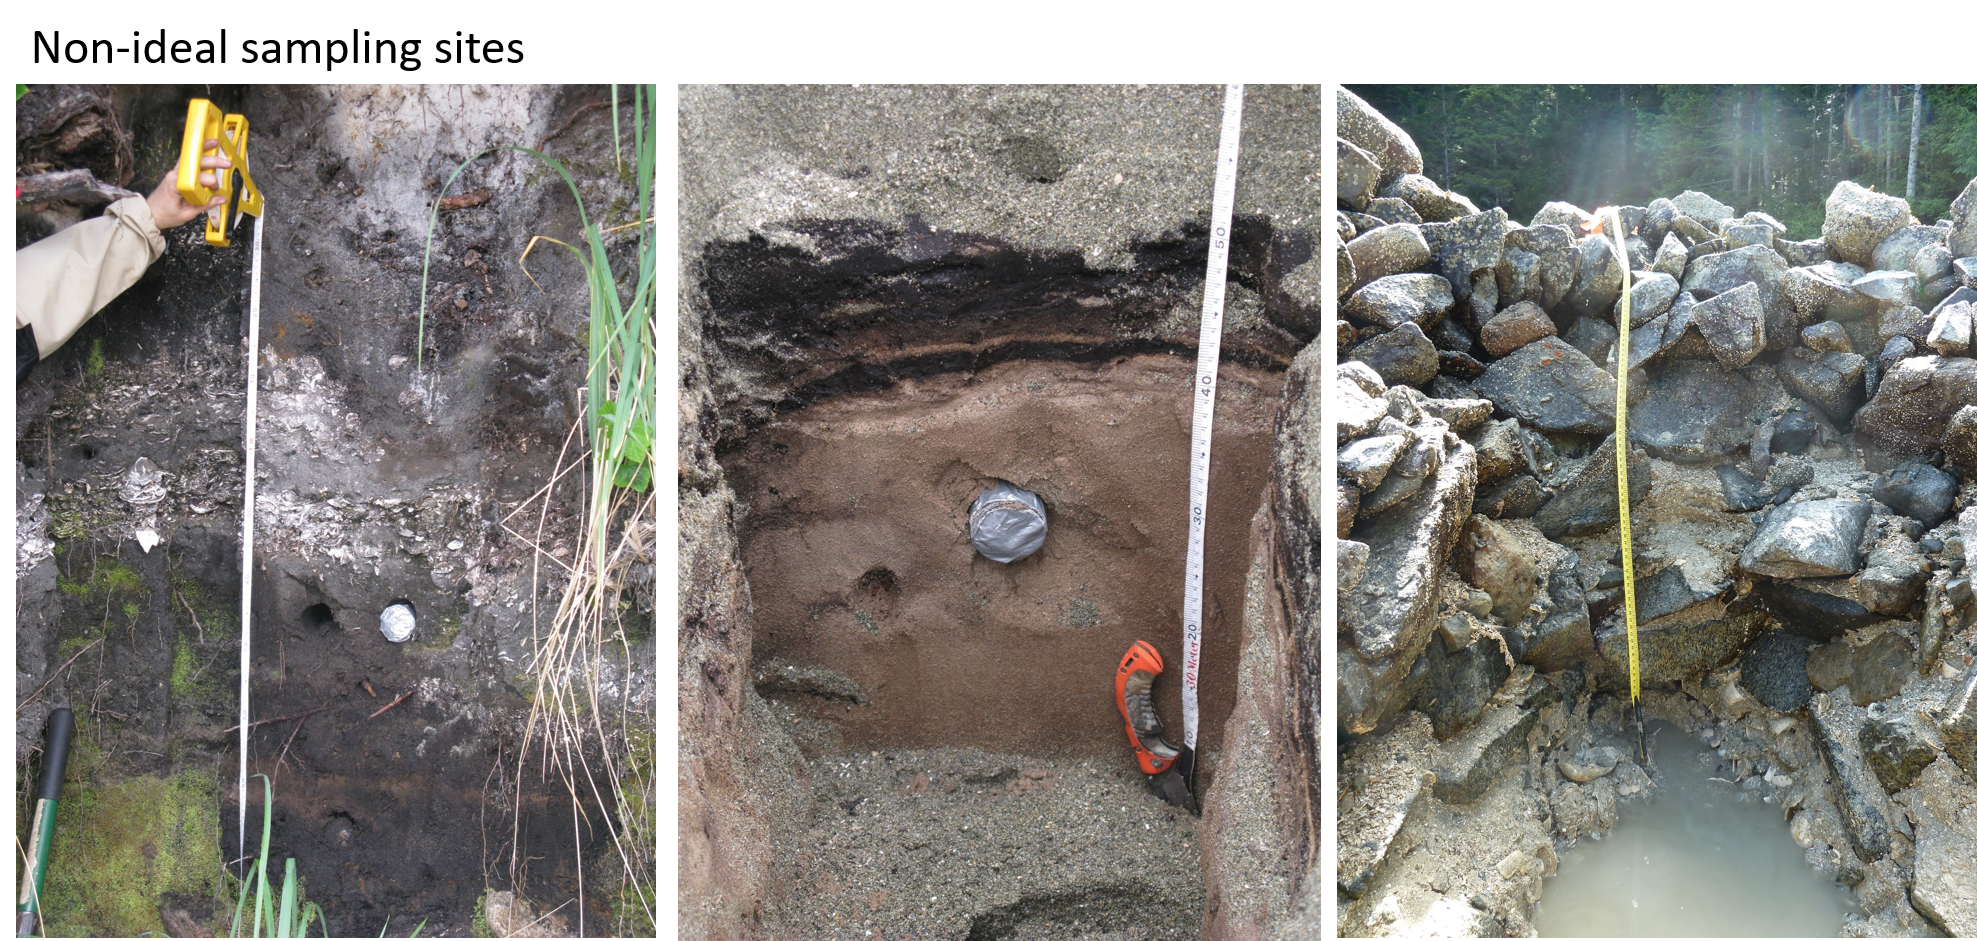
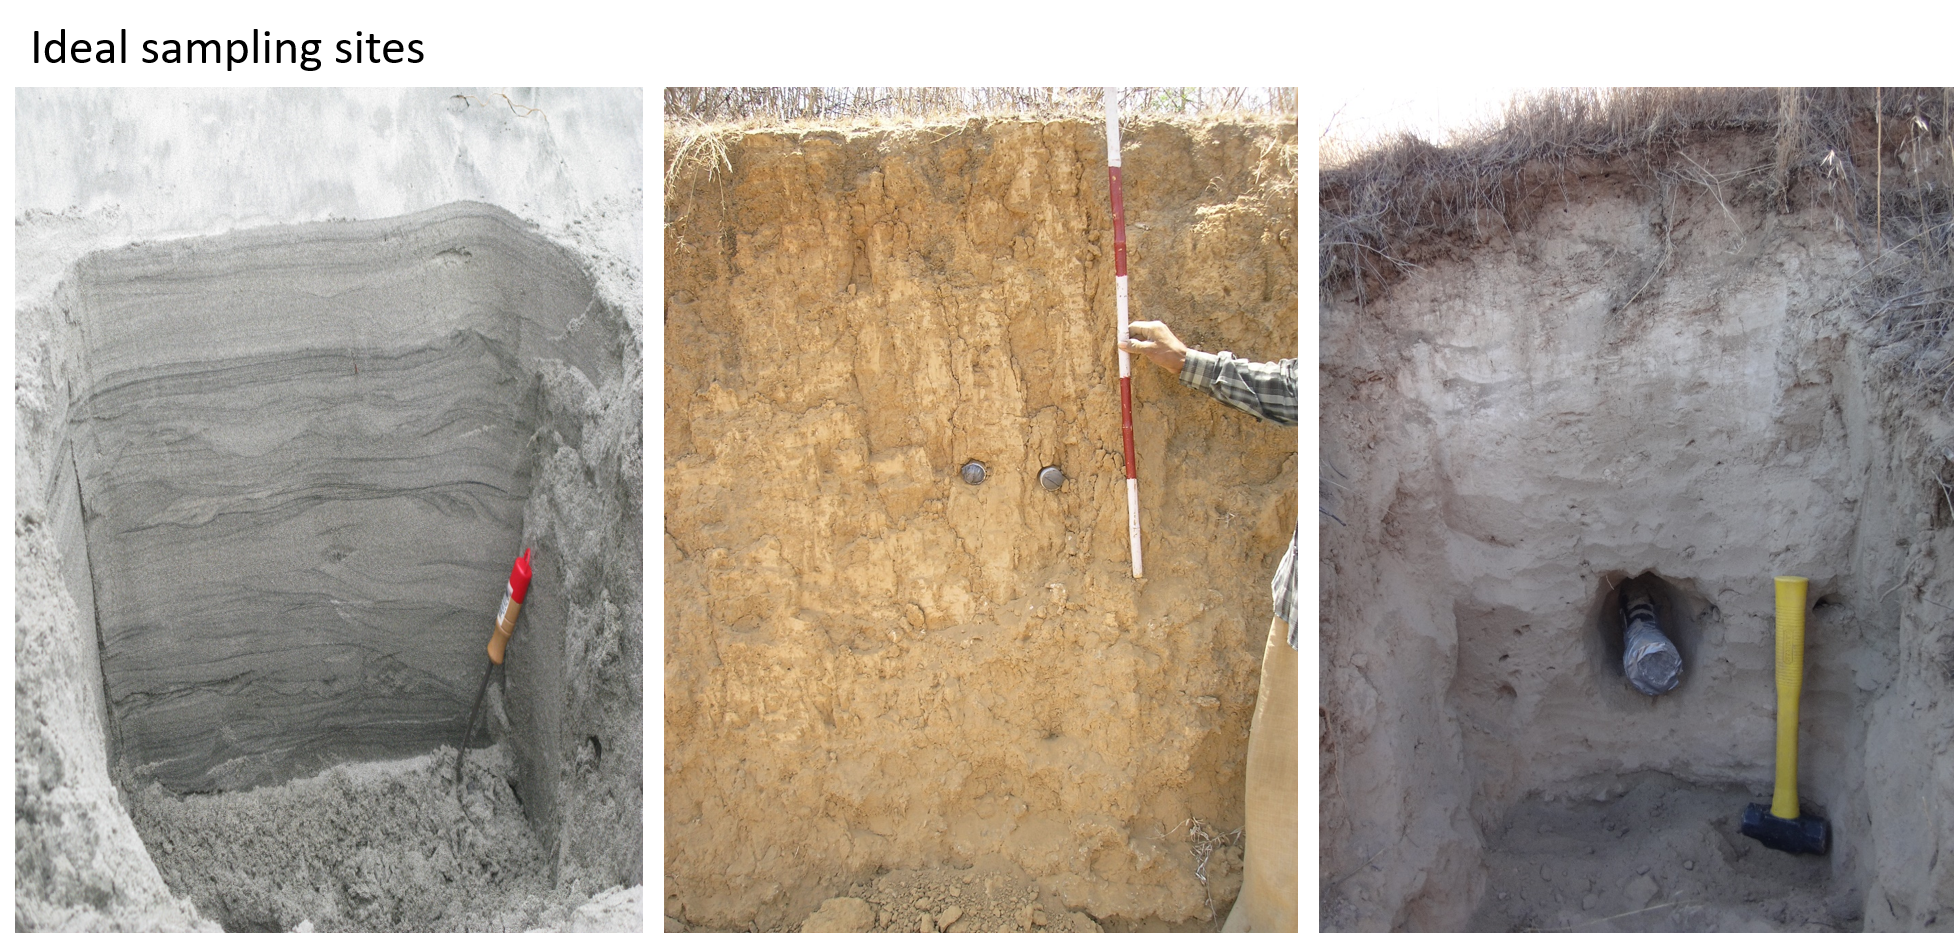
Because the sphere of influence of gamma rays is ~30 cm, we prefer to extract luminescence samples from areas where the composition and granulometry of the surrounding sediments is consistent (or homogeneous) within 30 cm of the sample.  If it is not, the dose rate that we measure from the sample may not accurately reflect the dose rate of the surrounding sediments. Examples of ideal and non-ideal sampling sites are shown below.

non-ideal.png
IDEAL.png

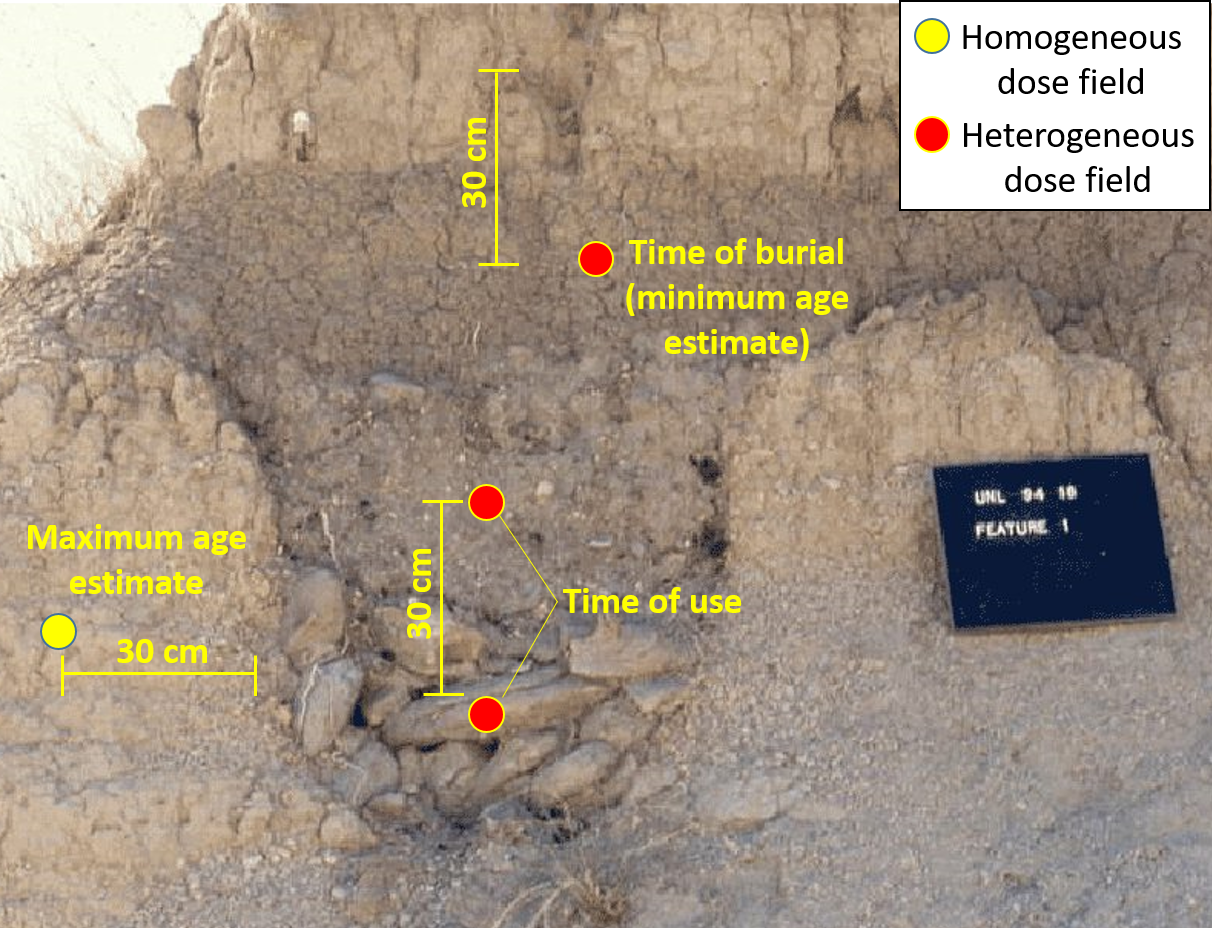
Often times, especially in archaeology, the feature we’d like to date does not provide a homogeneous dose field for sampling. In these cases, it’s necessary to: i) subsample individual lithostratigraphic layers/features within 30 cm of the sample site individually to estimate their dose rates so that the total dose rate of the sample can be modelled, and/or ii) measure the gamma dose rate to the sample directly in the field using a portable gamma spectrometer.

Possible sample sites (circles) for luminescence dating an earthwork ditch exposed in an archaeological trench at Garden Creek (Wright, 2011, “Earthwork Update” https://gardencreekarchaeology.wordpress.com/page/3/). The yellow circle shows a sample …

Possible sample sites (circles) for luminescence dating an earthwork ditch exposed in an archaeological trench at Garden Creek (Wright, 2011, “Earthwork Update” https://gardencreekarchaeology.wordpress.com/page/3/). The yellow circle shows a sample site where the gamma dose rate field is likely to be homogeneous. All other sample sites (red) are located in heterogeneous gamma dose rate fields. The 30 cm scale is hypothetical, and may not be accurate.

Possible sample sites (circles) for luminescence dating an escavated pit hearth in western Nebraska (Photo from the lesson plan by Damita Hiemstra, “Arner Site: Out of the Prairies of Western Nebraska”, http://d1vmz9r13e2j4x.cloudfront.net/nebstudie…

Possible sample sites (circles) for luminescence dating an escavated pit hearth in western Nebraska (Photo from the lesson plan by Damita Hiemstra, “Arner Site: Out of the Prairies of Western Nebraska”, http://d1vmz9r13e2j4x.cloudfront.net/nebstudies/Lesson4c_Arner.pdf). The yellow and red circles indicate homogeneous and heterogeneous gamma ray dose fields, respectively. The 30 cm scale is hypothetical, and may not be accurate.

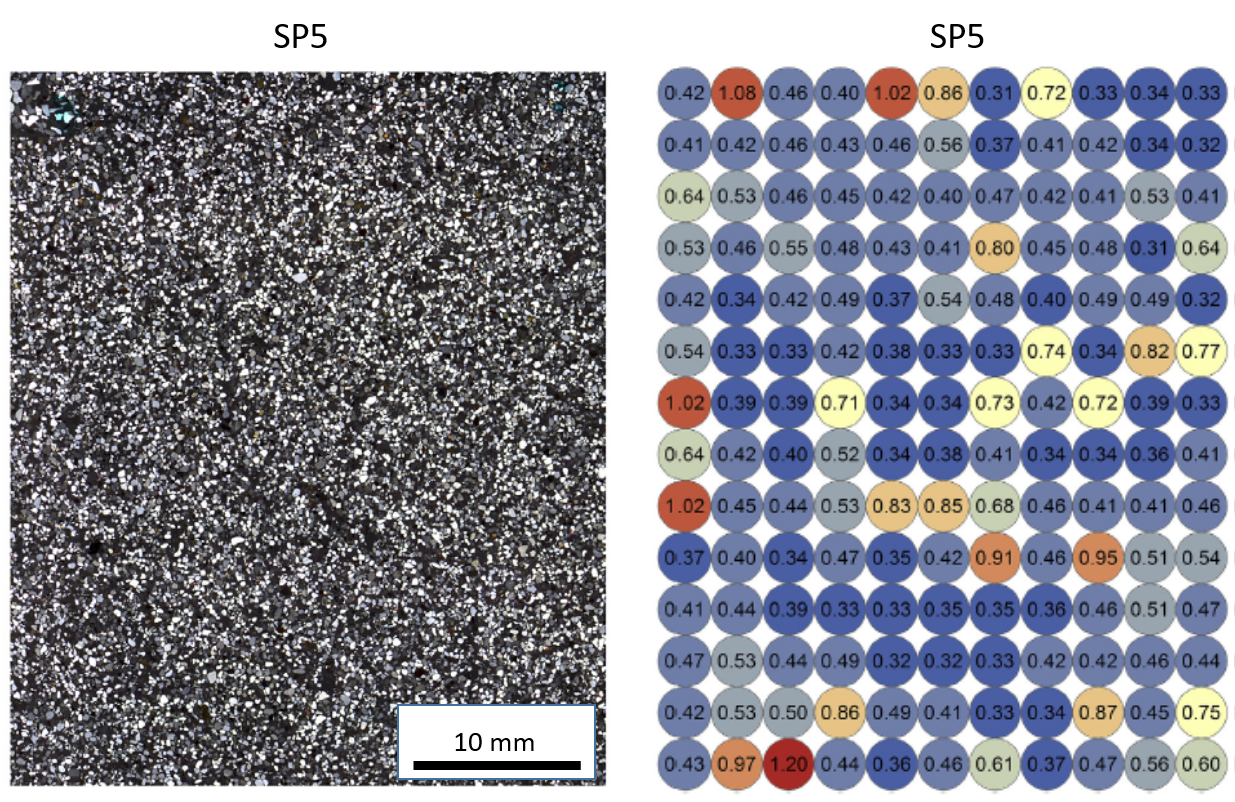
Heterogeneous dose fields are not only possible at the scale of a sedimentary exposure, but also at the scale of a thin section. This microscale heterogeneity is caused by spatial variations in beta dose rates, or “beta microdosimetry”. Spatial variations in K-40 concentrations (e.g., from K-feldspar grains) or U and Th in heavy minerals may lead to beta microdosimetry (e.g., Martin et al., 2015; Jankowski & Jacobs, 2018). This likely contributes to the spread (or overdispersion) of De and age distrubutions from single grains.

A) Stitched microphotograph of a thin section of beach sand from MacCauley’s Beach, NSW, Australia (sample SP5) shown in cross-polarized light. B) A beta dose rate (in Gy/ka) map created from portable XRF measurements of a separate impregnated block…

A) Stitched microphotograph of a thin section of beach sand from MacCauley’s Beach, NSW, Australia (sample SP5) shown in cross-polarized light. B) A beta dose rate (in Gy/ka) map created from portable XRF measurements of a separate impregnated block of the same sample. The spatial variations in beta dose rate in this sample can explain the spread in De values (overdispersion = 35%) measured from 170 individual grains (Jankowski & Jacobs, 2018).

Sampling for luminescence dating - Part I

Samples for luminescence dating can be collected in a myriad of ways, and can include different types of material. Materials most commonly dated are grains of sand or silt, however pottery, rock surfaces, rock art, and even archaeological constructions, such as walls and buildings have also been sampled.

Because luminescence dating methods determine the last time a mineral has been exposed to light or heat, it is imperative that light or heat is not introduced to the sample during the sampling process. This can be tricky! Below we list some common, and not so common ways of collecting luminescence samples. Stay tuned for upcoming blogs that delve into more details about the sampling process.

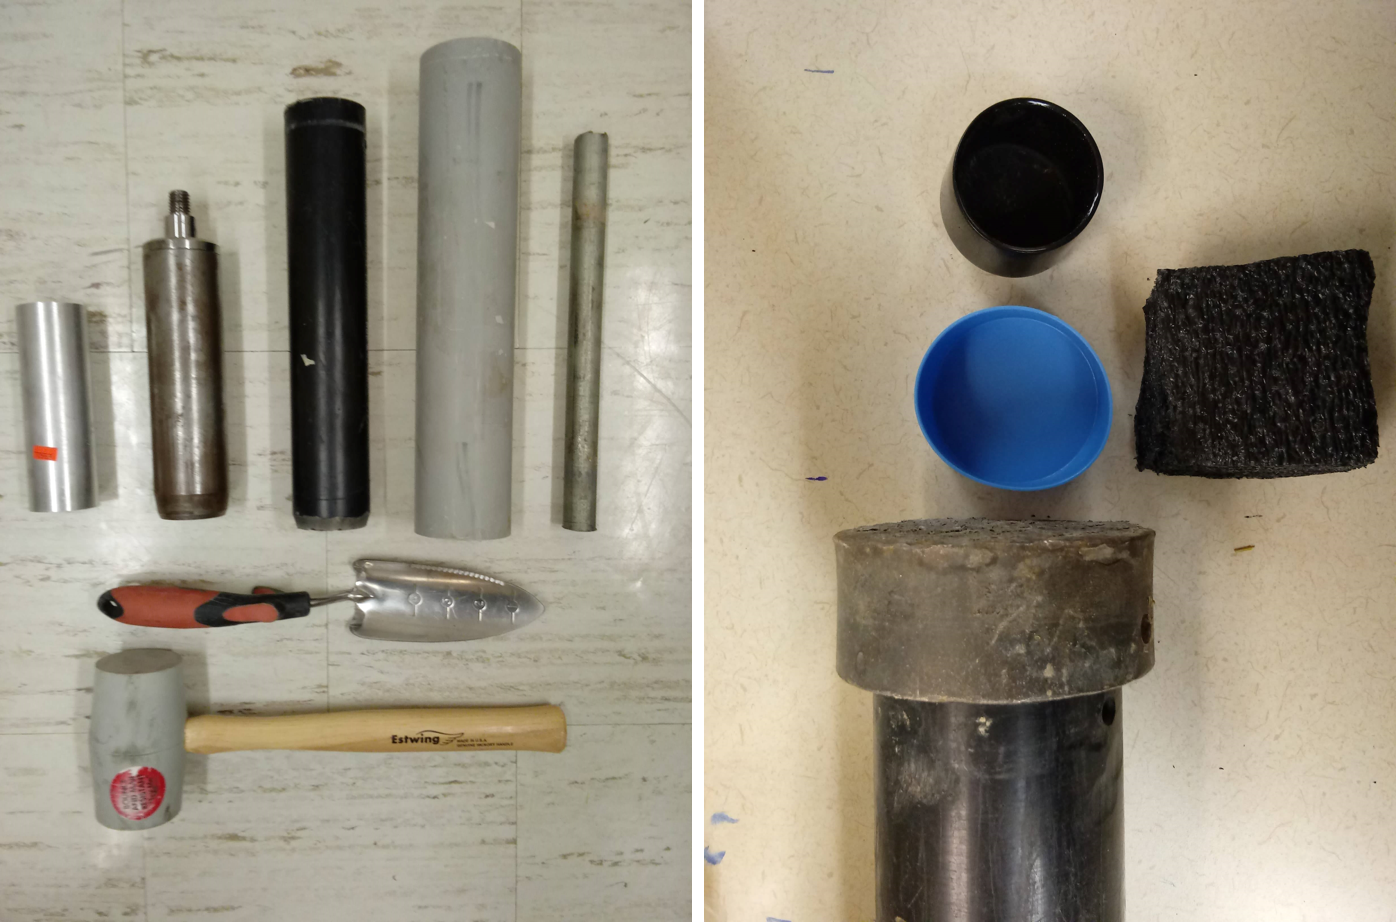
1) Sampling tubes. This is the most common method of collecting a luminescence sample from sediments. Sampling tubes are typically hammered into a sedimentary exposure, or the side of an archaeological trench, to collect sediments from the sedimentary unit or archaeological layer of interest.

OSL_tube.png

Before hammering, the tube may be stuffed with foam, plastic or paper. After the tube is fully inserted, it is then excavated back out, and the light-exposed ends are sealed with opaque plastic, tape or a cap. The size of the tube you use, will depend on the thickness of the unit/layer you are sampling, and how much time you think it took for the sediment to accumulate. To avoid obtaining an imprecise age, tubes of smaller diameter should be used for sedimentary units thought to have accumulated over long periods of time.

Luminescence sample tubes of various sizes (LEFT). A steel cap may be placed on the end of the tube to protect it during hammering (RIGHT), and the tube ends can be sealed with a cap, opaque plastic or tape. Sample tubes are commonly stuffed with a …

Luminescence sample tubes of various sizes (LEFT). A steel cap may be placed on the end of the tube to protect it during hammering (RIGHT), and the tube ends can be sealed with a cap, opaque plastic or tape. Sample tubes are commonly stuffed with a paper, plastic or foam “plug” (RIGHT) prior to hammering the tube into the sediments. This ensures that the sediments remain compact, minimizing any mixing between sun-exposed grains and non-exposed grains during transport. If a sample is collected subaqueously, it is not advisable to use a plug, as this may force sediment-laden water back out the unplugged end, contaminating non-light-exposed sediments.

2) A hand auger. Luminescence samples can be collected using an auger equipped with a light-tight core sampler, allowing us to target sediments several meters below the surface.

Luminescence sampling by hand auger (LEFT). A beveled, light-tight core sampler (RIGHT). Photo credits: Amanda Keen-Zebert (left), christina neudorf (right)

Luminescence sampling by hand auger (LEFT). A beveled, light-tight core sampler (RIGHT). Photo credits: Amanda Keen-Zebert (left), christina neudorf (right)

3) Coring. Luminescence samples can be extracted from sediment cores that have been collected by hand, by percussion coring, or by vibracoring. If cores are collected from loose or saturated sediments, a core catcher maybe placed at the penetrating end of the core to prevent sediment from falling back out during extraction.

Sediment cores collected by hand using ABS pipe (LEFT). ABS pipe is less prone to fracture than PVC pipe, especially in rocky substrates. Cores may be extracted using a tripod and winch system (LEFT-CENTER). A core catcher (RIGHT-CENTER & RIGHT)…

Sediment cores collected by hand using ABS pipe (LEFT). ABS pipe is less prone to fracture than PVC pipe, especially in rocky substrates. Cores may be extracted using a tripod and winch system (LEFT-CENTER). A core catcher (RIGHT-CENTER & RIGHT) can prevent the loss of sediment during core extraction. pHOTO CREDITS: CHRISTINA NEUDORF

In a light-safe lab, multiple luminescence samples can be extracted from a single core to construct “age vs depth” profiles.

Core sample sediments in a light-safe lab, ready for subsampling for luminescence dating AT THE UNIVERSITY OF THE FRASER VALLEY. PHOTO CREDIT: CHRISTINA NEUDORF

Core sample sediments in a light-safe lab, ready for subsampling for luminescence dating AT THE UNIVERSITY OF THE FRASER VALLEY. PHOTO CREDIT: CHRISTINA NEUDORF

4) Block samples. When luminescence sample tubes cannot penetrate extremely cohesive sands or silts, it may be necessary to extract a block sample. This can be done using a rock hammer or saw. After sampling, the block is wrapped tightly in opaque plastic, then shipped in containers with sufficient cushioning (e.g., bubble wrap) to prevent the block from cracking during transport. Once in the light-safe lab, the outer-most sediments are carefully carved away from the block before the inner, non-light-exposed sediments are processed for dating.

A block sample collected from cohesive sandy silts along the Snake River, Idaho. PHOTO CREDITS: TOM BULLARD

A block sample collected from cohesive sandy silts along the Snake River, Idaho. PHOTO CREDITS: TOM BULLARD

5) Under a tarp, or at night. If light contamination cannot be prevented using sampling tubes or cores, a sample may be collected under an opaque tarp and/or at night. Finding tarp material that is truly light-safe can be tricky, and multiple layers may be necessary. As always, the sample must be packaged in such a way that any surface sediments that were exposed to the sun during the day do not contaminate the non-light-exposed sediments.

Luminescence sampling under a tarp IN NEWFOUNDLAND, CANADA. Tape was applied to creases susceptible to light penetration, and multiple layers of material was used. If you choose to sample this way, do it quickly and with lots of helping hands - You …

Luminescence sampling under a tarp IN NEWFOUNDLAND, CANADA. Tape was applied to creases susceptible to light penetration, and multiple layers of material was used. If you choose to sample this way, do it quickly and with lots of helping hands - You do not want to suffocate! PHOTO CREDIT: GREGORY MUMFORD

6) Rock surface sampling. The surfaces of boulders or cobbles can be sampled for luminescence dating by coring and slicing (e.g., Freiesleben, et al., 2015; Jenkins et al., 2018). Rock surface dating has also been applied to rock art (e.g., Liritzis et al., 2018). Cores can be extracted using a hand drill with a diamond-tipped drill core, then sliced into sub-centimeter thick slices using a microsaw or wafering blade. A water cooling system for both the core and saw may be necessary to prevent the sample from heating up due to friction. Rock slices may be crushed and prepared as sediment samples prior to measurement, or measured directly.

Rock surface sampling steps for luminescence dating. the ~9 mm diameter rock core was extracted from a granite boulder from Quadra Island, British Columbia, Canada. The rock slice is from granite sampled by Meyer et al. (2018). Slices can then be mo…

Rock surface sampling steps for luminescence dating. the ~9 mm diameter rock core was extracted from a granite boulder from Quadra Island, British Columbia, Canada. The rock slice is from granite sampled by Meyer et al. (2018). Slices can then be mounted into a luminescence reader and measured directly as shown by Freiesleben (2014) (FAR RIGHT).

7) Brick or stone structures and monuments. Pieces of archaeological structures can be sampled by chiselling, coring, or, in the case of limestone structures, acid treatment prior to the extraction of quartz inclusions (e.g., Bailiff, 2007; Liritzis, 2010; Stella et al., 2014).

Drill core sampling brick from a late-Post medieval English building (Bailiff, 2007) (TOP). Method of sampling a megalithic wall (shown is Mykerinus pyramid, Egypt) (BOTTOM) (Liritzis, 2011).

Drill core sampling brick from a late-Post medieval English building (Bailiff, 2007) (TOP). Method of sampling a megalithic wall (shown is Mykerinus pyramid, Egypt) (BOTTOM) (Liritzis, 2011).

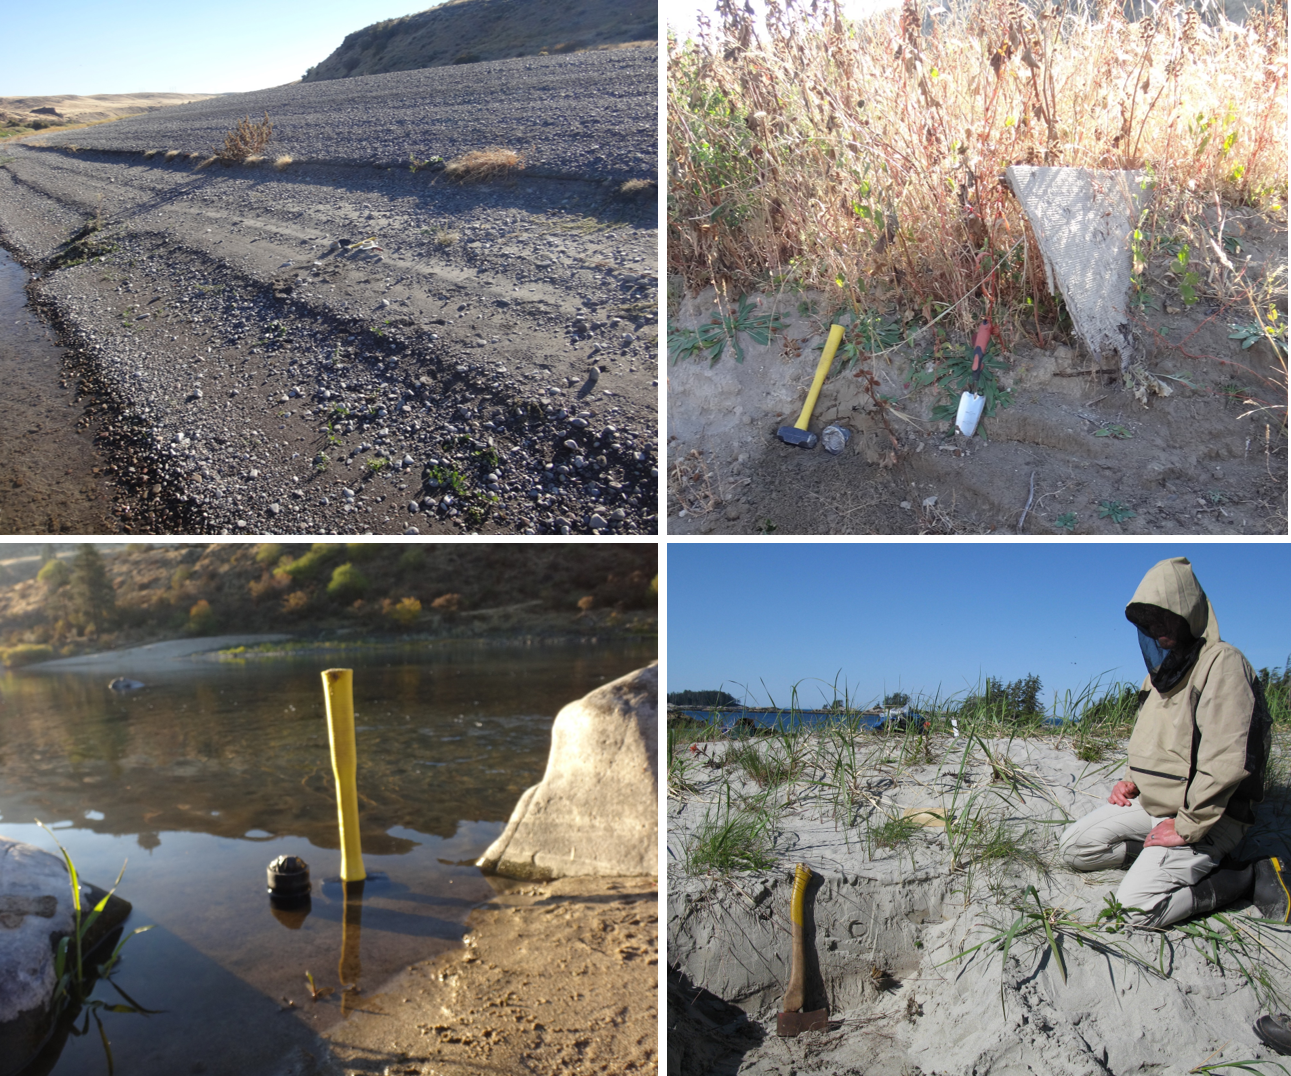
In most cases, it is desirable to collect a “modern” sample to check how well the luminescence signal is re-set during sun-exposure. This allows us to evaluate ages from our ancient samples, by determining the likelihood that their signals were also fully re-set prior to burial. The modern sample should be collected from rocks or sediments that have experienced the same mode of transport and deposition as the ancient samples. Unfortunately, even when this is the case, there is always the possibility that the bleaching history of the modern sample will not be representative of the ancient samples collected at the same site.

Modern samples should be collected at sites with bleaching conditions thought to be representative of the ancient samples of interest. (TOP LEFT) A modern sandy gravel bar in the Snake River, Idaho. (TOP RIGHT). A vegetated sand bar in the Snake Riv…

Modern samples should be collected at sites with bleaching conditions thought to be representative of the ancient samples of interest. (TOP LEFT) A modern sandy gravel bar in the Snake River, Idaho. (TOP RIGHT). A vegetated sand bar in the Snake River, Idaho. (BOTTOM LEFT) Shallow-water river sediments adjacent to an archaeological site in Idaho. PHOTO CREDITS: CHRISTINA NEUDORF. (BOTTOM RIGHT) The crest of a sand dune on Calvert Island, British Columbia. PHOTO CREDIT: OLAV LIAN