Field photos: "Do’s" and "Don’ts"…

When collecting samples for luminescence dating in the field, it’s crucial to obtain informative photos of your sample site, whether or not they are included in your final publication. These help document the stratigraphic position of your samples, as well as the landforms and sedimentary units they were collected from. After several years of critiquing students, we’ve compiled a list of “Do’s” and “Don’ts” for good quality photos.

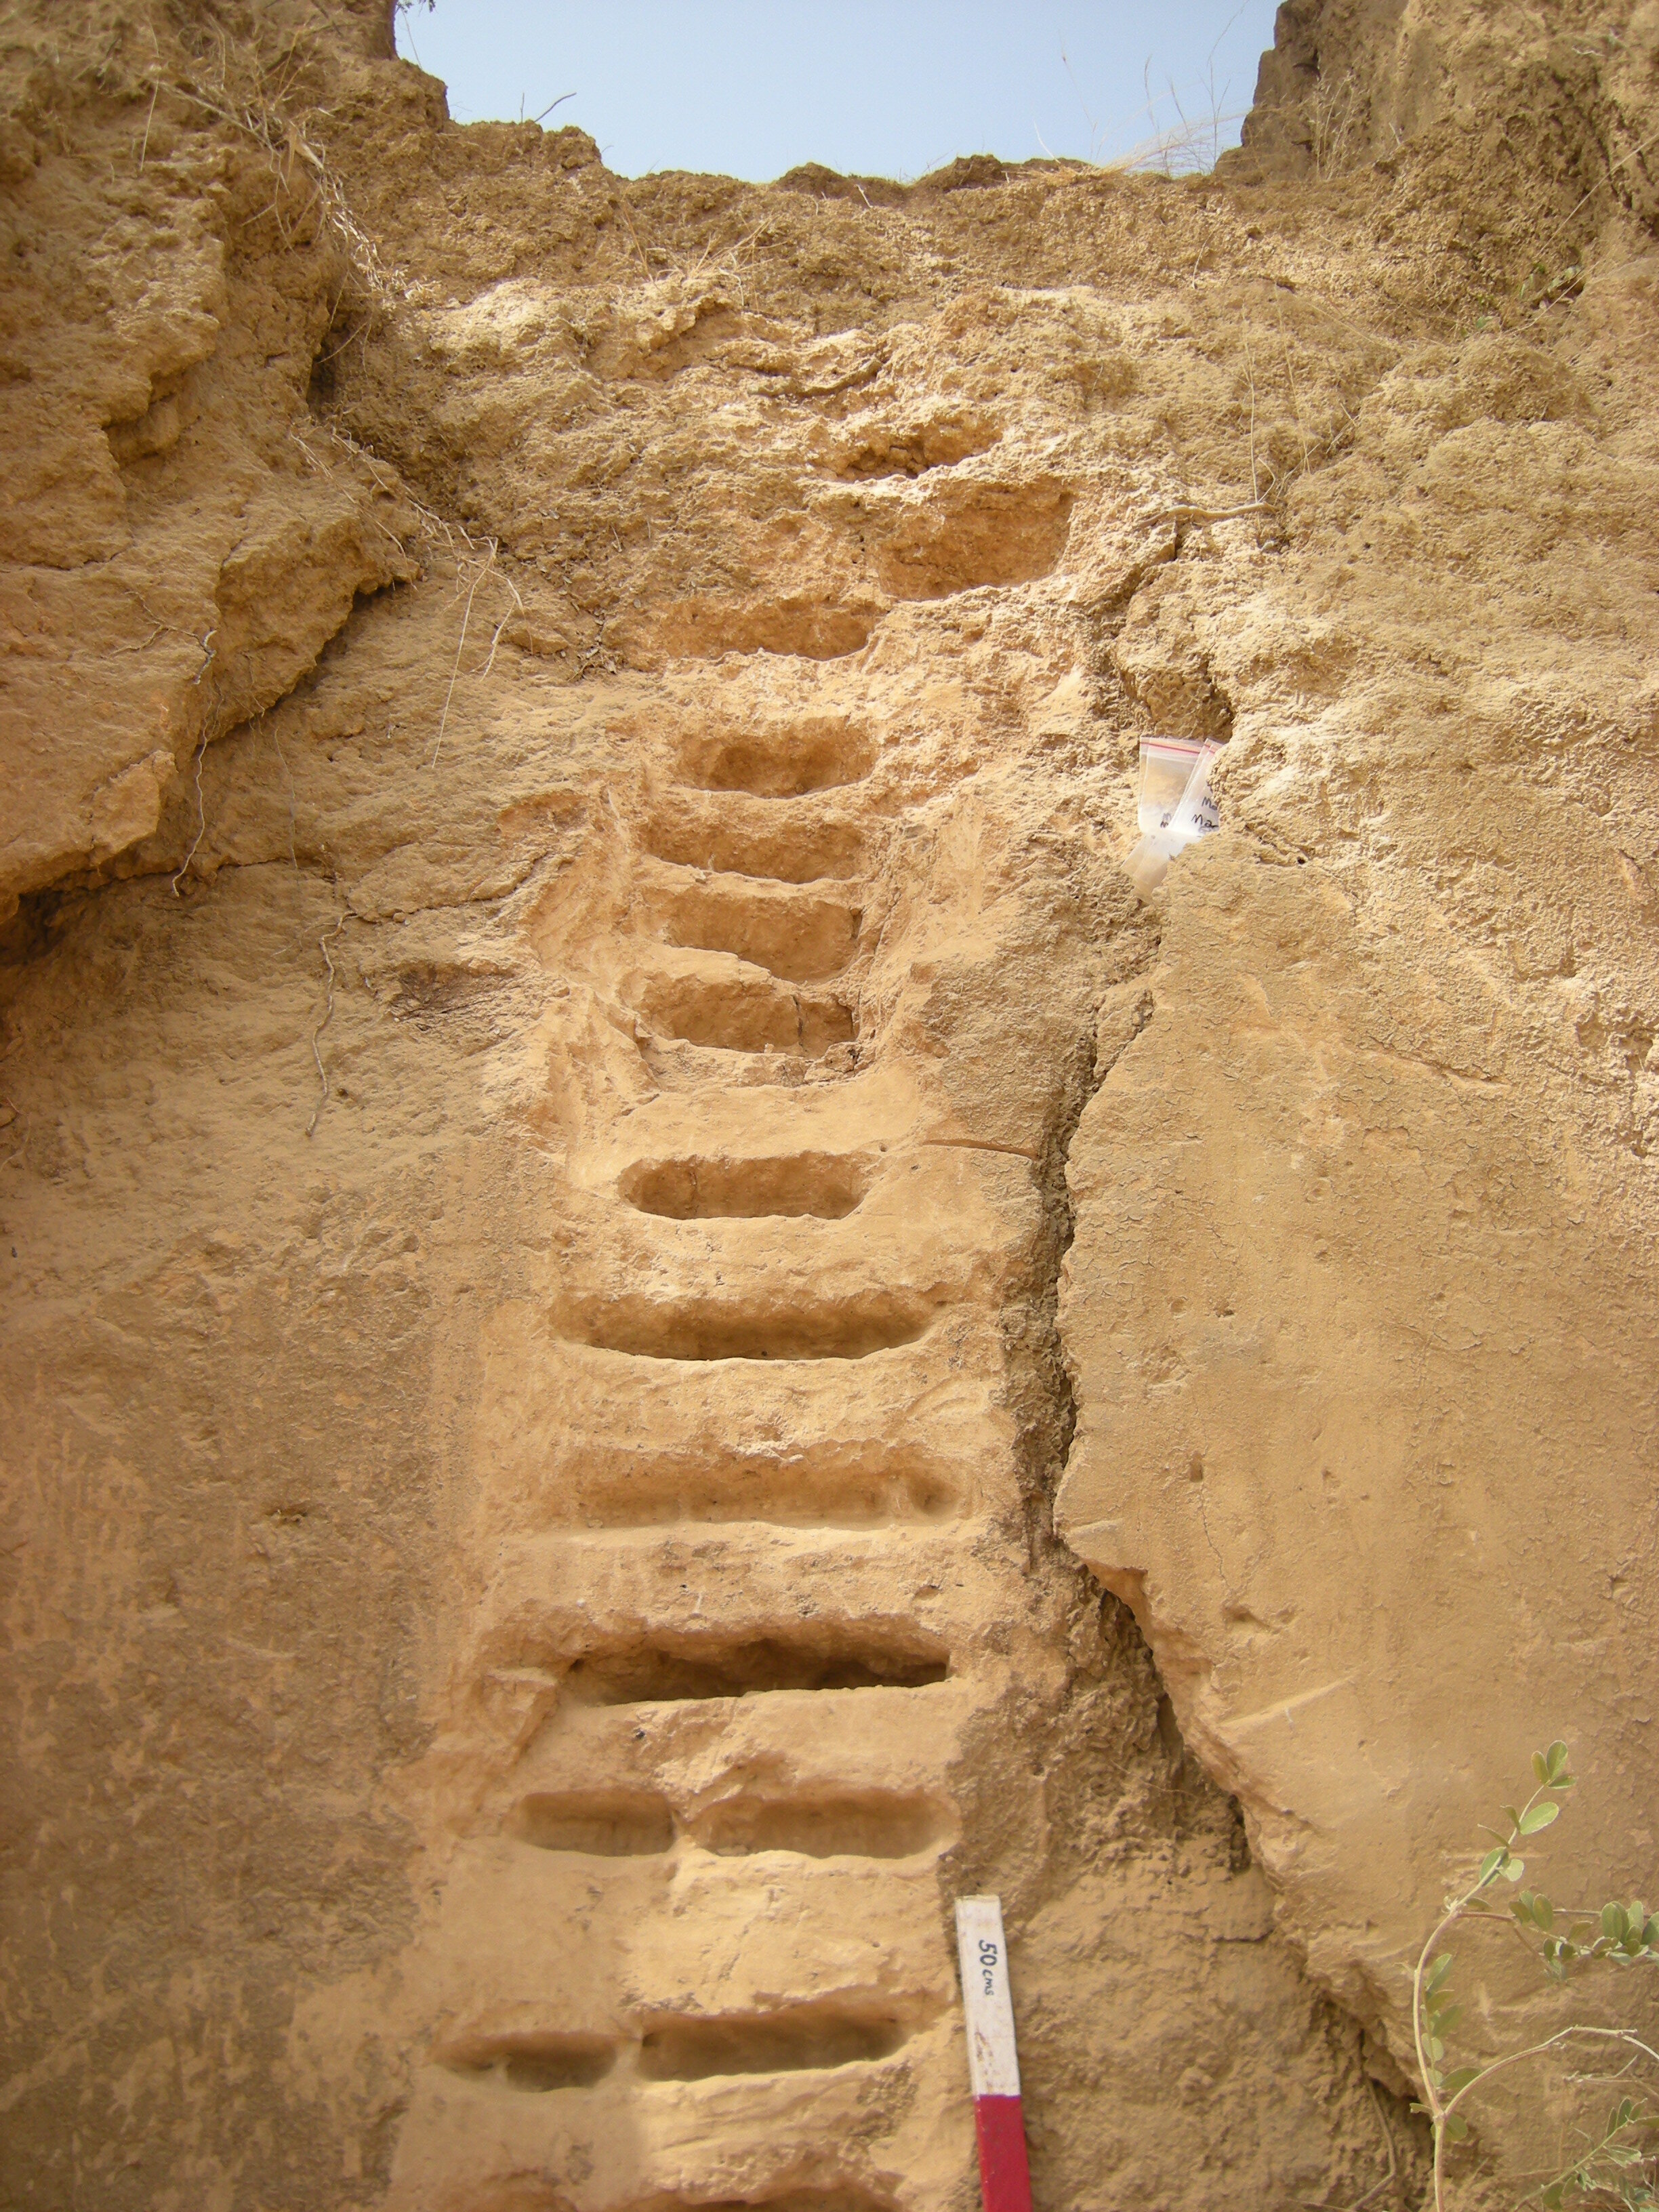
DON’T focus all of your photos on the sample tube hole.

Jan24-27-09 028.jpg

This will provide very limited information. Be sure to back up and include photos of the entire exposure where possible, so that the stratigraphic location of the luminescence sample can be assessed. Typically these photos are taken alongside detailed notes on the sedimentology, stratigraphy, and any associated archaeology at the site.

Jan24-27-09 027.jpg

DON’T estimate luminescence sample depths or stratigraphic unit thicknesses from photos.

Mar06-10-09 003.jpg

This information should be measured and recorded using the proper equipment (measuring tape and/or inclinometer) in the field. Photos from tall/deep exposures will be distorted, especially if they are taken at close range.

DO take photos when the sun is oriented favorably.

shadows.png

Capturing effective images may mean waiting until the best time of day to avoid casting shadows that block the view.

DO clean your sedimentary exposure before taking the picture.

(LEFT) Before section cleaning. (RIGHT) After section cleaning.

(LEFT) Before section cleaning. (RIGHT) After section cleaning.

This includes removing any slopewash or dust from the surface, as well as smoothing the surface flat so that sedimentary structures are most visible. It is also common practice to take photos of the cleaned exposure prior to sampling, so that the sample hole does not mask the stratigraphy.

DO use panoramas to capture the entire sedimentary section.

pans.png

If your camera does not have a panorama function, individual, overlapping photos can be stitched together to create a panorama in graphic software, such as Photoshop. Some image distortion is inevitable in panoramas, so state whether or not this has been corrected for in your figure caption.

DON’T assume the photo will capture all of the details.

annotation.png

Take thorough notes in the field, and for more complicated exposures, draw section diagrams to capture all of the details. You can then use this info to annotate your photos later.

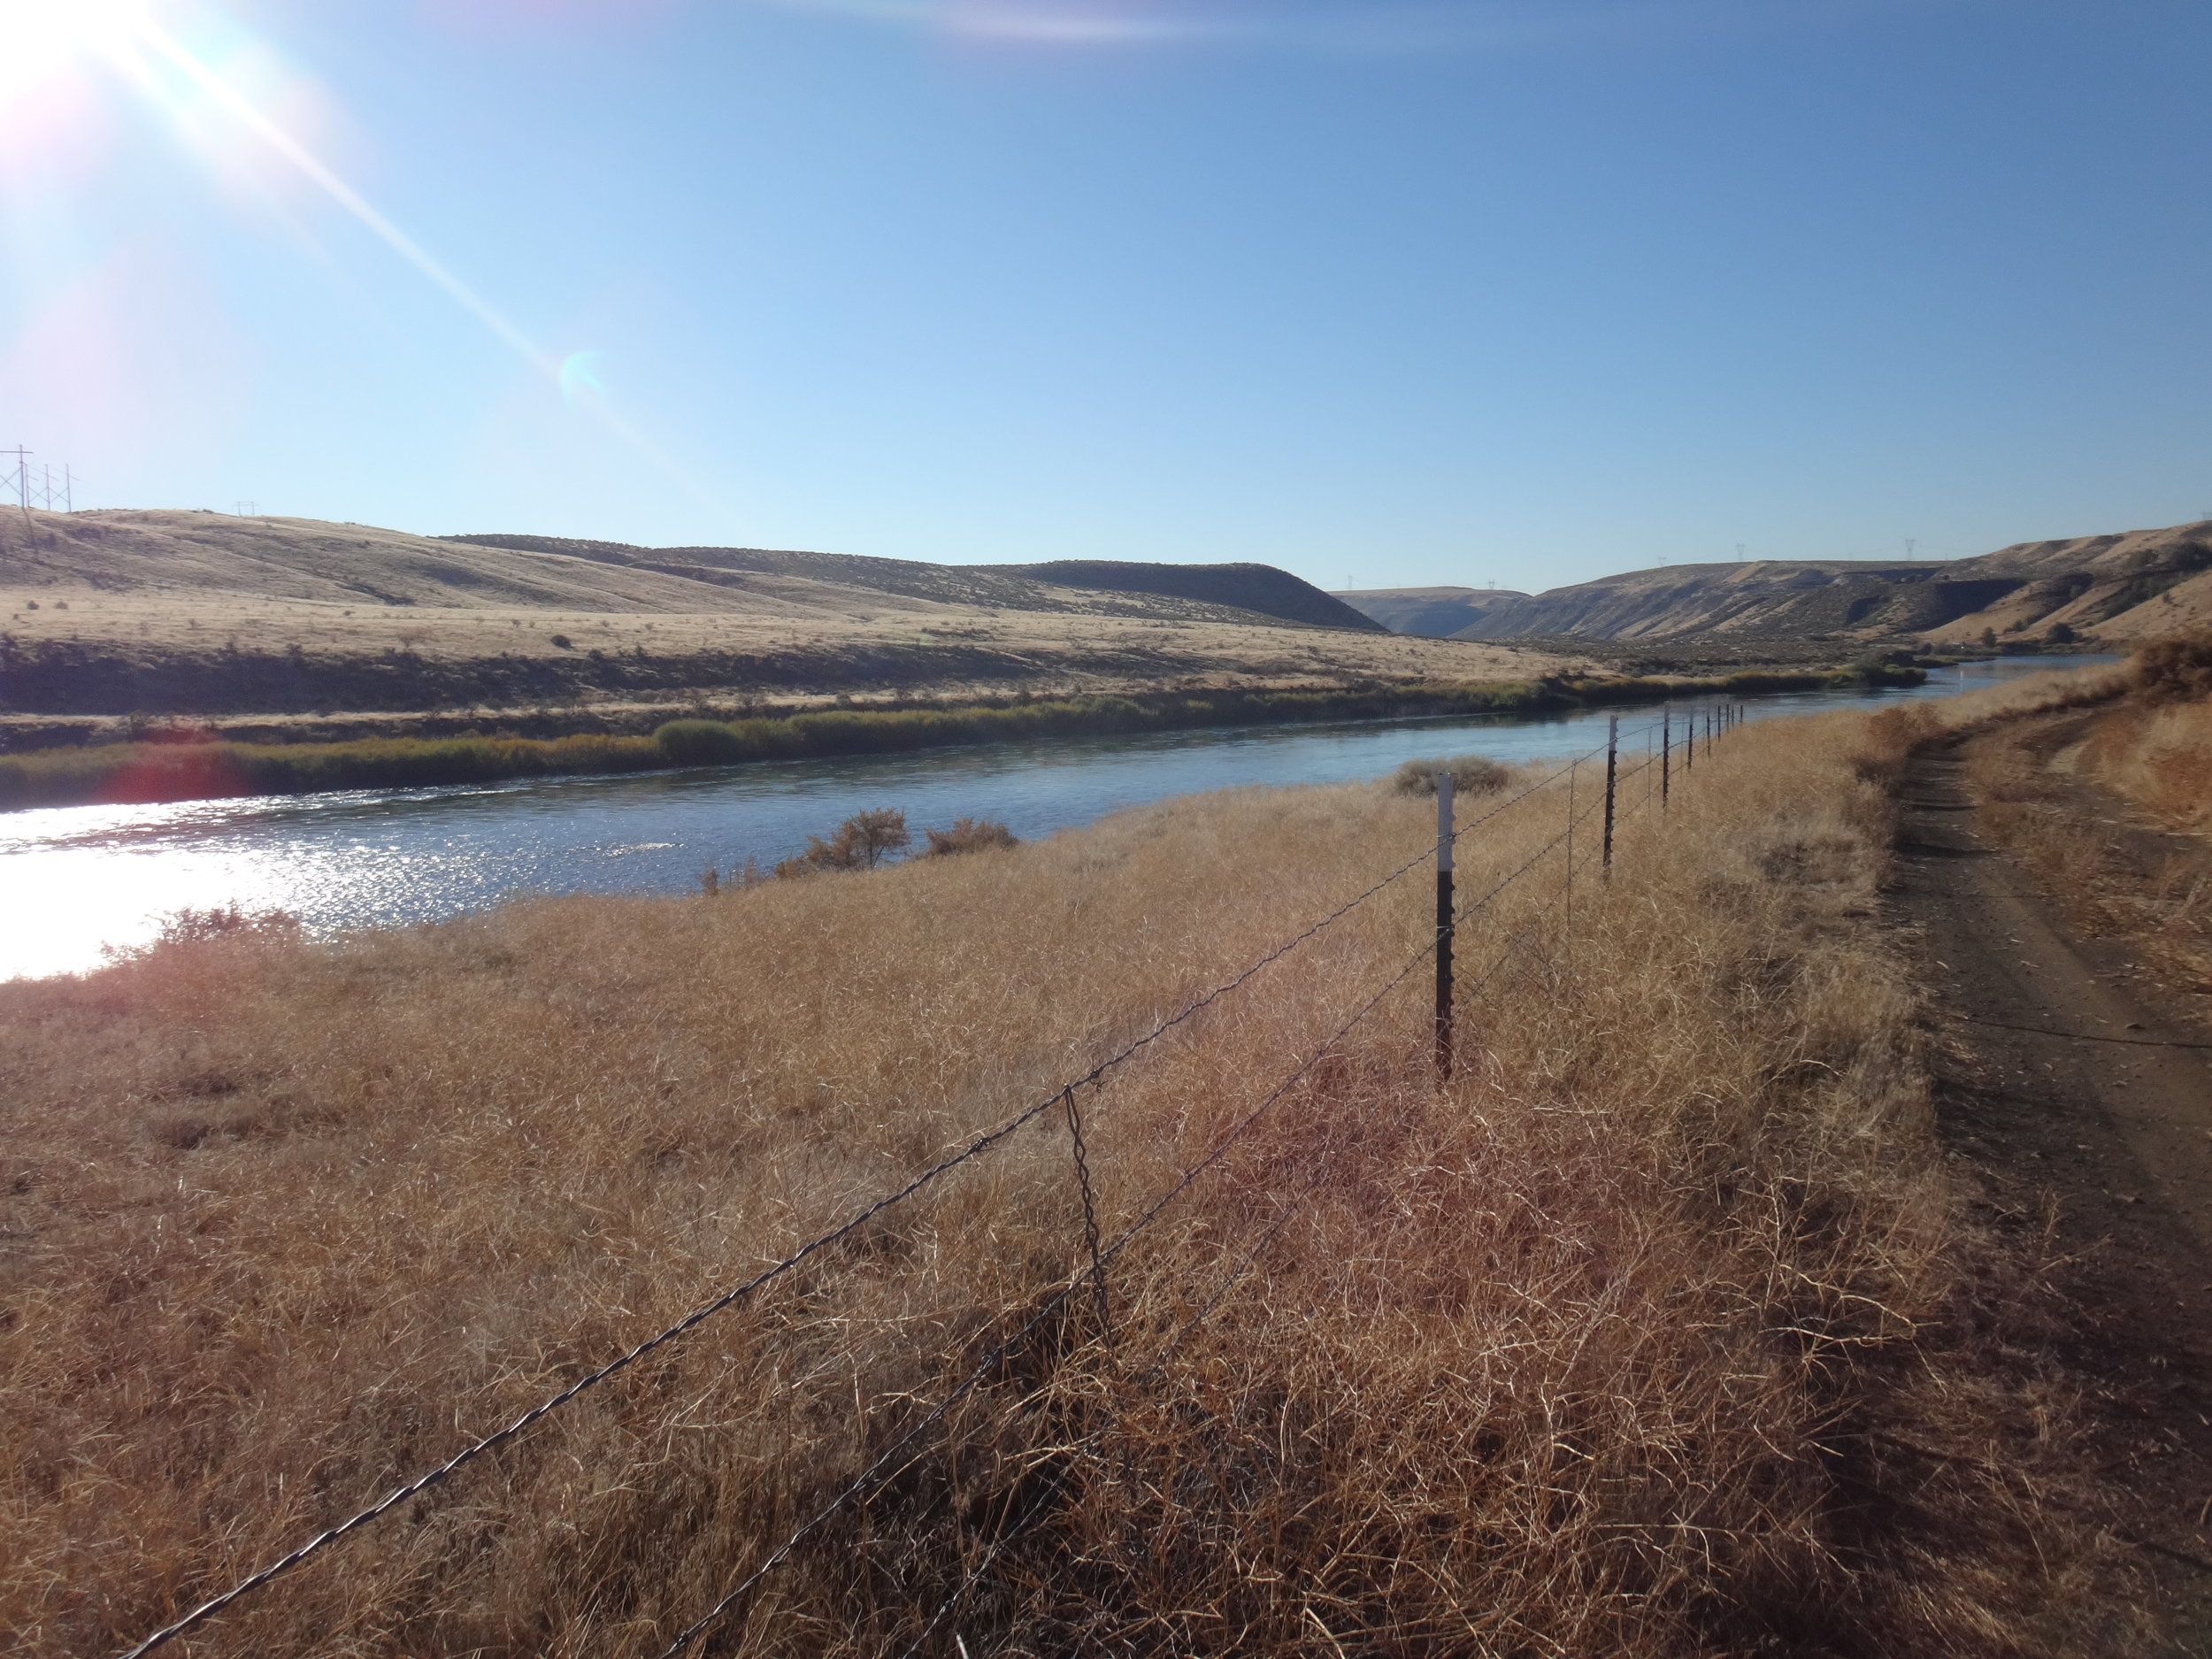
DO take photos of the surrounding landscape.

Sampling fluvial silts and sands deposited by ancestral Son River, in the Son Valley, Madhya Pradesh, India.

Sampling fluvial silts and sands deposited by ancestral Son River, in the Son Valley, Madhya Pradesh, India.

Sampling unsorted colluvial deposits comprised of weathered shale derived from local bedrock, Son Valley, Madhya Pradesh, India.

Sampling unsorted colluvial deposits comprised of weathered shale derived from local bedrock, Son Valley, Madhya Pradesh, India.

These will help document the geomorphic context of your sample site, as well as the surficial processes operating at the site today. Modern-day fluvial, colluvial, eolian or other surficial processes may explain some or all of the sedimentary units you observe in your sedimentary exposure.

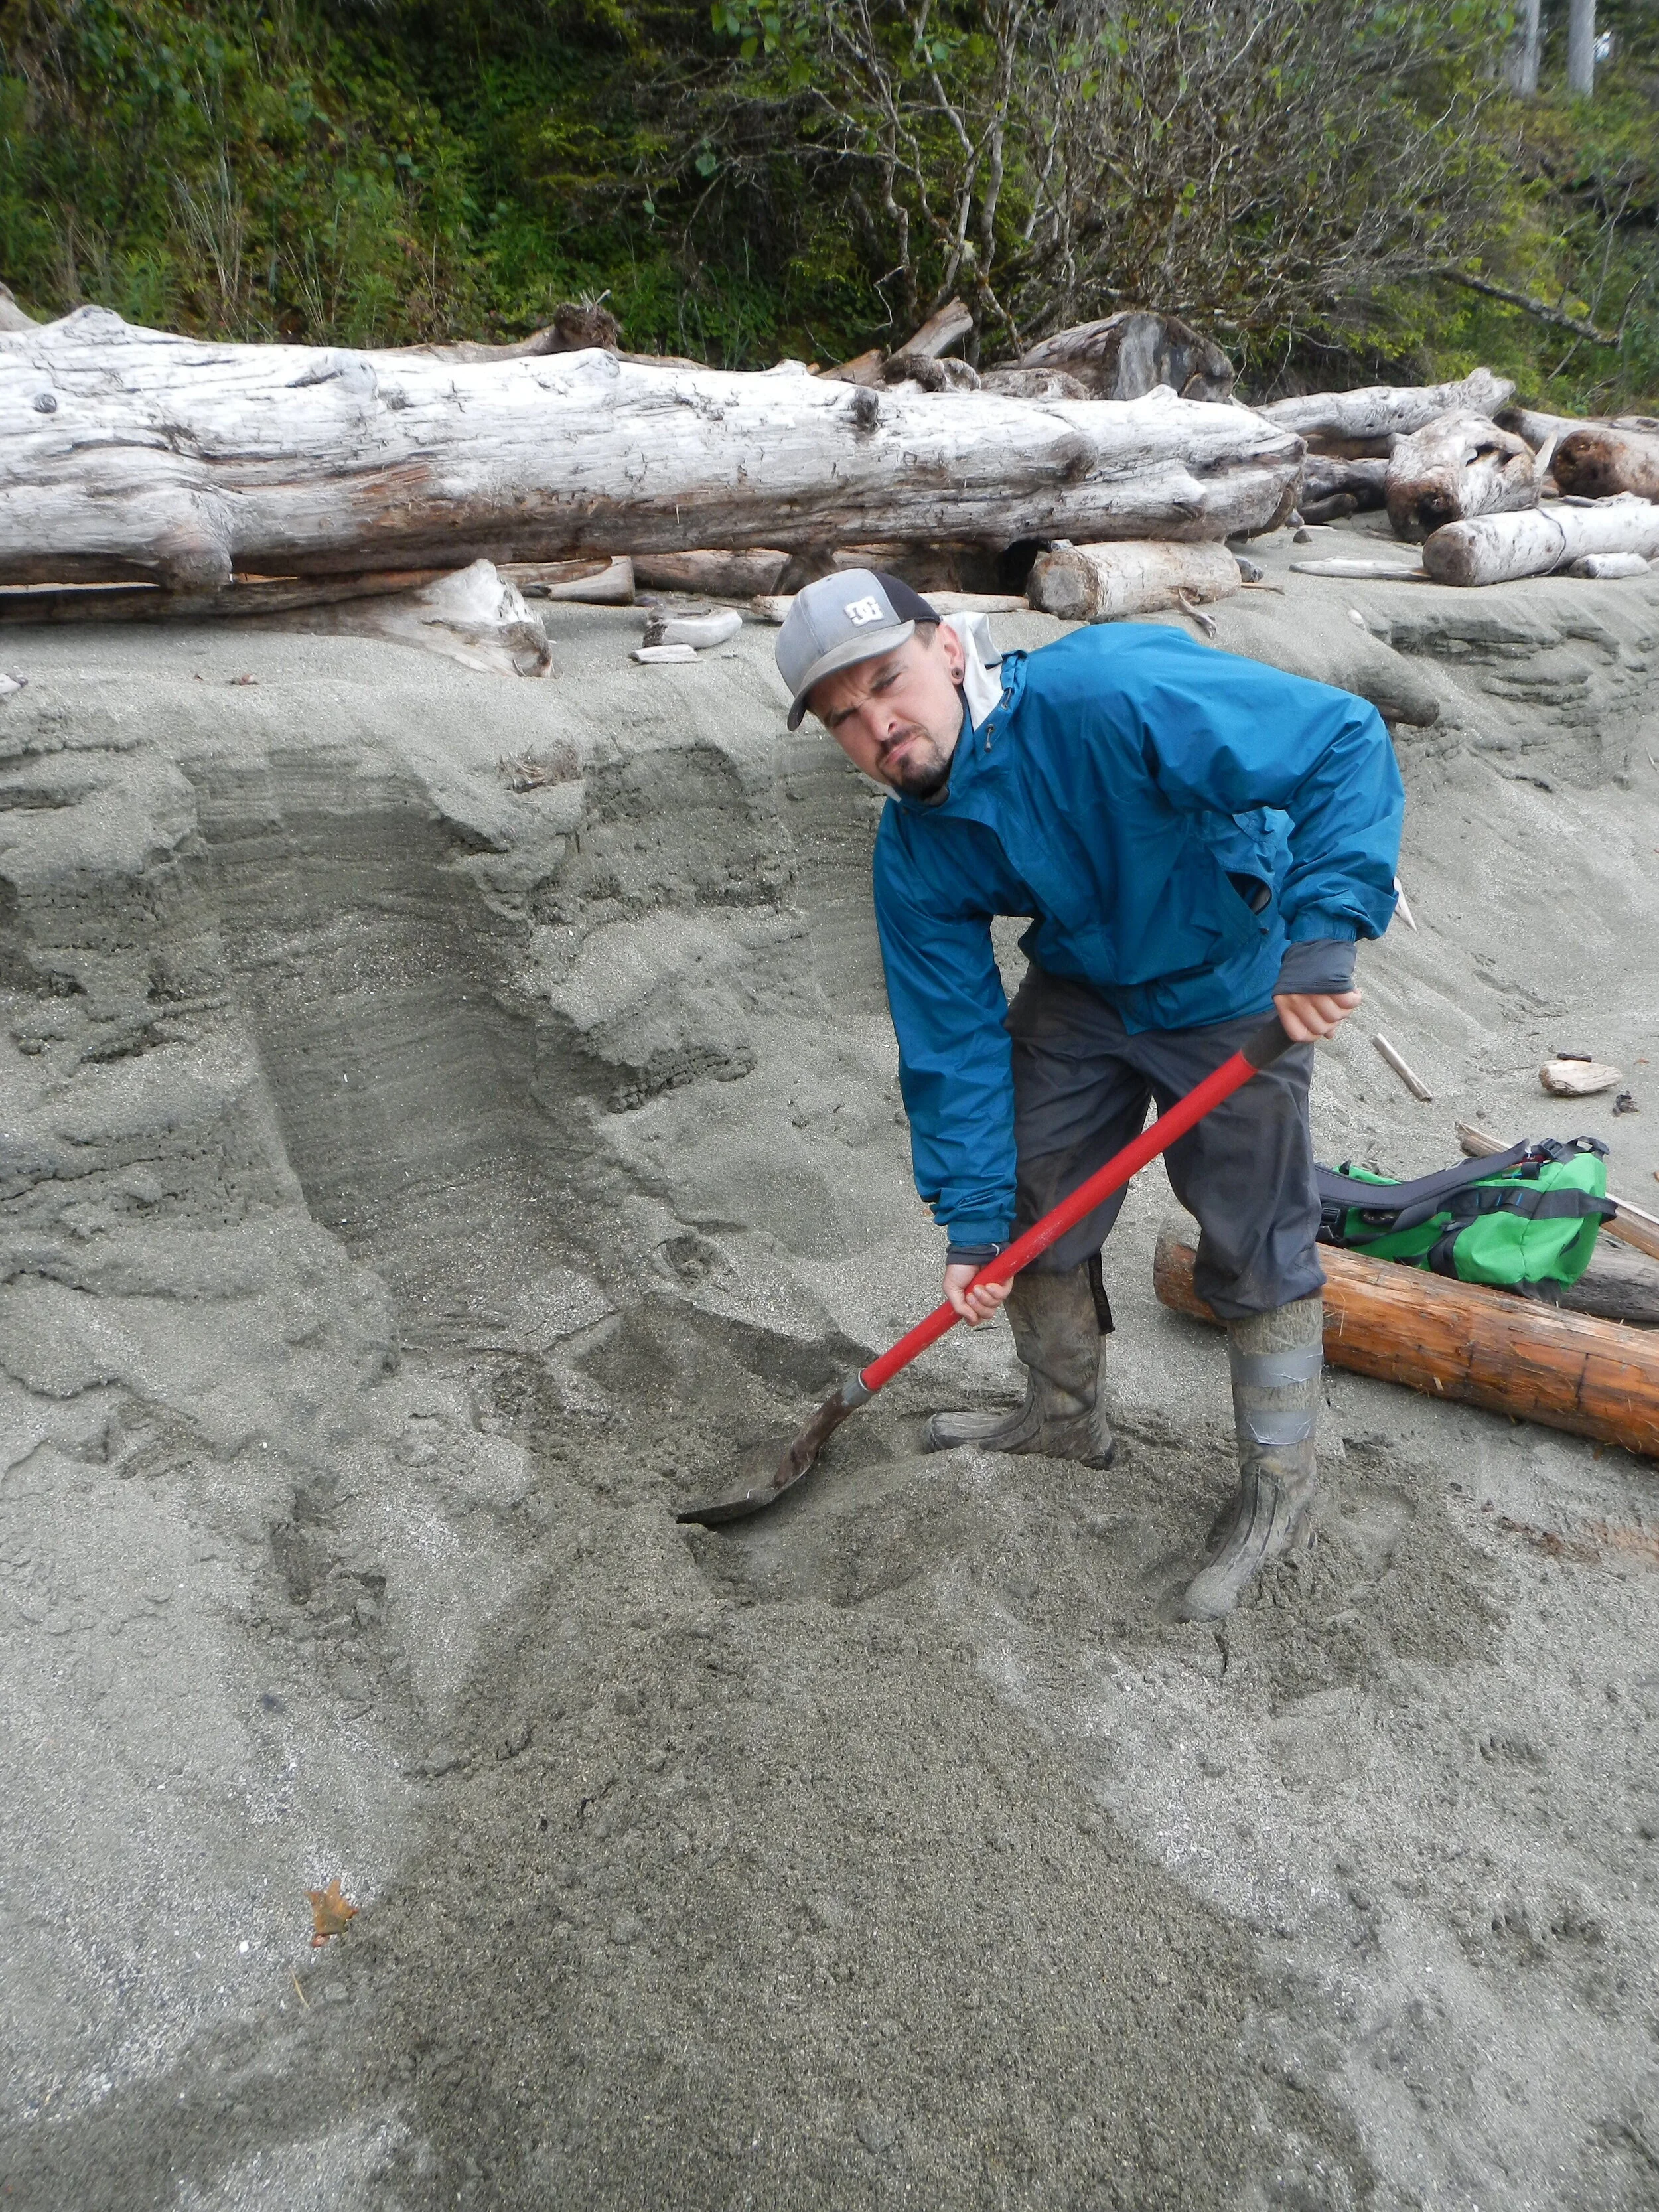
Sampling waterlogged sands preserving paleosols in a bog on Calvert Island, British Columbia, Canada.

Sampling waterlogged sands preserving paleosols in a bog on Calvert Island, British Columbia, Canada.

Sampling beach sands containing peat on Calvert Island, British Columbia, Canada.

Sampling beach sands containing peat on Calvert Island, British Columbia, Canada.

DO include a scale.

scale.png

A field geologist’s toolkit can include scales of all shapes and sizes. If a scale is not available, a rock hammer, camera case, or even a person will do just fine! Just be sure to specify the dimensions of your scale in your figure caption.

Ancient eolian sands exposed in a roadcut in Tasmania. Amy Robertson, of the Forest Practices Authority, Tasmania, for scale. Photo credit: Tim Barrows.

Ancient eolian sands exposed in a roadcut in Tasmania. Amy Robertson, of the Forest Practices Authority, Tasmania, for scale. Photo credit: Tim Barrows.

And last but not least, DO SMILE!!
SMILE.JPG

Sampling for luminescence dating – Part III

When sampling for luminescence dating, it is important to collect samples for water content measurement, as well as for optical and dose rate measurements. Water content (typically reported as a percentage of a mass of dry sediment) is determined for the sediments collected at the sampling site to help “guestimate” how moist a sample was over its entire burial history. (And yes, we do mean “guestimate”…)

Snake River, ID.JPG

So, why do we care?

Water absorbs radiation emitted from sediments at sample site. This means that if sediments were wet during their entire burial history, they will have lower environmental dose rates than those that were dry (all other factors being equal). So if we assume a sample has been dry, when in fact it was wet, our calculated age will be an underestimate.

subaqueous.JPG

Ironically, the moisture history of a sample is not only one of the largest controlling factors on its environmental dose rate, it is also the most difficult to determine. It is usually derived from measured sample water contents in the laboratory, as well as the climatic and geomorphic context of the site. Was the sample taken from a river terrace, alluvial fan, or some other landform that was inundated by a river in the past? Was the sample taken at a depth close to, or below the water table? Has the water table risen or dropped through time? All of these factors should be considered, and appropriate (i.e. large) error should be applied to any water content value to account for these uncertainties.

(LEFT) Calculated age vs estimated water content for two dune samples from Tasmania (Neudorf et al., 2019). These sediments become saturated at a water content of ~20% (blue shaded region), and measured water contents of collected samples were 15 ± …

(LEFT) Calculated age vs estimated water content for two dune samples from Tasmania (Neudorf et al., 2019). These sediments become saturated at a water content of ~20% (blue shaded region), and measured water contents of collected samples were 15 ± 3% (grey shaded region). The age estimate of the young sample (W4014) ranges from ~16 ka to ~19 ka, while the age estimate of the older sample (SB7) ranges from ~175 ka to ~210 ka – a difference of ~35 ka! (RIGHT) The change in absolute age with water content decreases as the age of a sample decreases. For instance, if we recalculate the ages of sample W4014 assuming this sample De value is only ¼ of its true value, then a 20% increase in assumed water content will increase the age by less than 1000 years.

The influence of water content on alpha, beta, gamma and total environmental dose rates at the site of sample W4014 (Neudorf et al., 2019). Water can absorb all three forms of radiation (alpha, beta and gamma), but it has the largest impact on alpha…

The influence of water content on alpha, beta, gamma and total environmental dose rates at the site of sample W4014 (Neudorf et al., 2019). Water can absorb all three forms of radiation (alpha, beta and gamma), but it has the largest impact on alpha dose rates. The alpha dose rate error is an order of magnitude larger than the errors of all other dose rates, and have been removed from the graph for clarity.

The influence that water content has on sample age, not only depends on the true age of the sample, but also the mineral and grain size fraction that was dated. Below are some examples.

The influence of water content on a sample age can depend on the grain size used for dating. Thompson et al. (2018) dated sample LED11-210 using both the 4-11 µm (FQ) and 90-180 µm (SA) quartz fractions. Water content has a slightly smaller influenc…

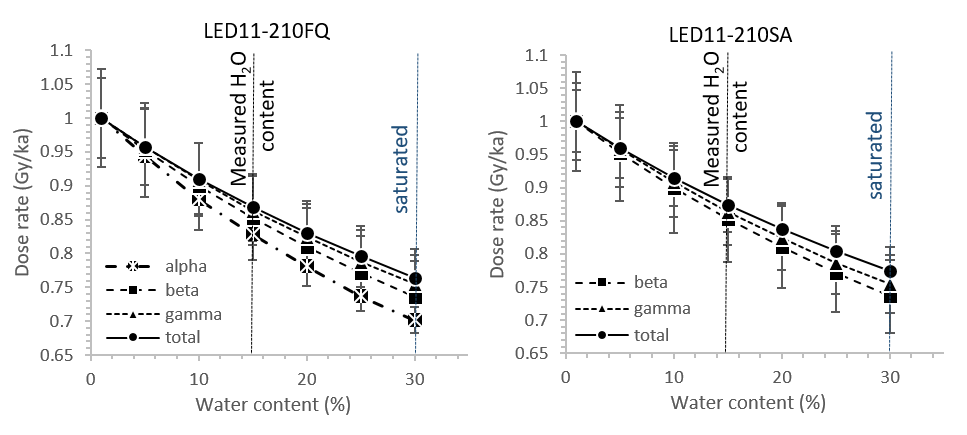
The influence of water content on a sample age can depend on the grain size used for dating. Thompson et al. (2018) dated sample LED11-210 using both the 4-11 µm (FQ) and 90-180 µm (SA) quartz fractions. Water content has a slightly smaller influence on the larger grain size because i) the coarse quartz grains were treated with HF acid to remove the outer alpha-penetrated rind as is commonly done in coarse grain luminescence dating, and ii) radiation is not attenuated in fine grains as much as it is in coarser grains. The measured water contents include an error of 15% that is not plotted for clarity.

Dose rate (parsed by radiation type) vs water content for the fine grain (LEFT) and coarse grain (RIGHT) samples of Thompson et al. (2018) in the previous figure. The measured water contents include an error of 15% that is not plotted for clarity.

Dose rate (parsed by radiation type) vs water content for the fine grain (LEFT) and coarse grain (RIGHT) samples of Thompson et al. (2018) in the previous figure. The measured water contents include an error of 15% that is not plotted for clarity.

The influence of water content on quartz and feldspar ages measured from the same sample (T4BATT03) (Smedley et al., 2017; 2019). Water content has a slightly larger influence on age estimates from quartz than from feldspar because a proportion of t…

The influence of water content on quartz and feldspar ages measured from the same sample (T4BATT03) (Smedley et al., 2017; 2019). Water content has a slightly larger influence on age estimates from quartz than from feldspar because a proportion of the total dose rate absorbed by feldspar grains comes from K-40 inside the grains. The grey shading covers ±5% error on the water content measurement.

Dose rate (parsed by radiation type) vs water content is plotted for both quartz (LEFT) and feldspar (RIGHT) grains from sample T4BATT03 (previous figure). Again, the alpha contribution can be excluded from the dose rate for the quartz sample, becau…

Dose rate (parsed by radiation type) vs water content is plotted for both quartz (LEFT) and feldspar (RIGHT) grains from sample T4BATT03 (previous figure). Again, the alpha contribution can be excluded from the dose rate for the quartz sample, because this sample has been treated with HF acid to remove the alpha-penetrating outer rind. The grey shading covers ±5% error on the water content measurement.

Sampling for luminescence dating – Part II

Luminescence dating techniques determine the length of time a mineral has been buried by measuring the total radiation dose that mineral has acquired from surrounding sediments and cosmic rays from outer space. So when we collect samples in the field, it’s important to consider where that radiation is coming from, and whether nearby features in the sampling environment may deliver radiation at different rates.

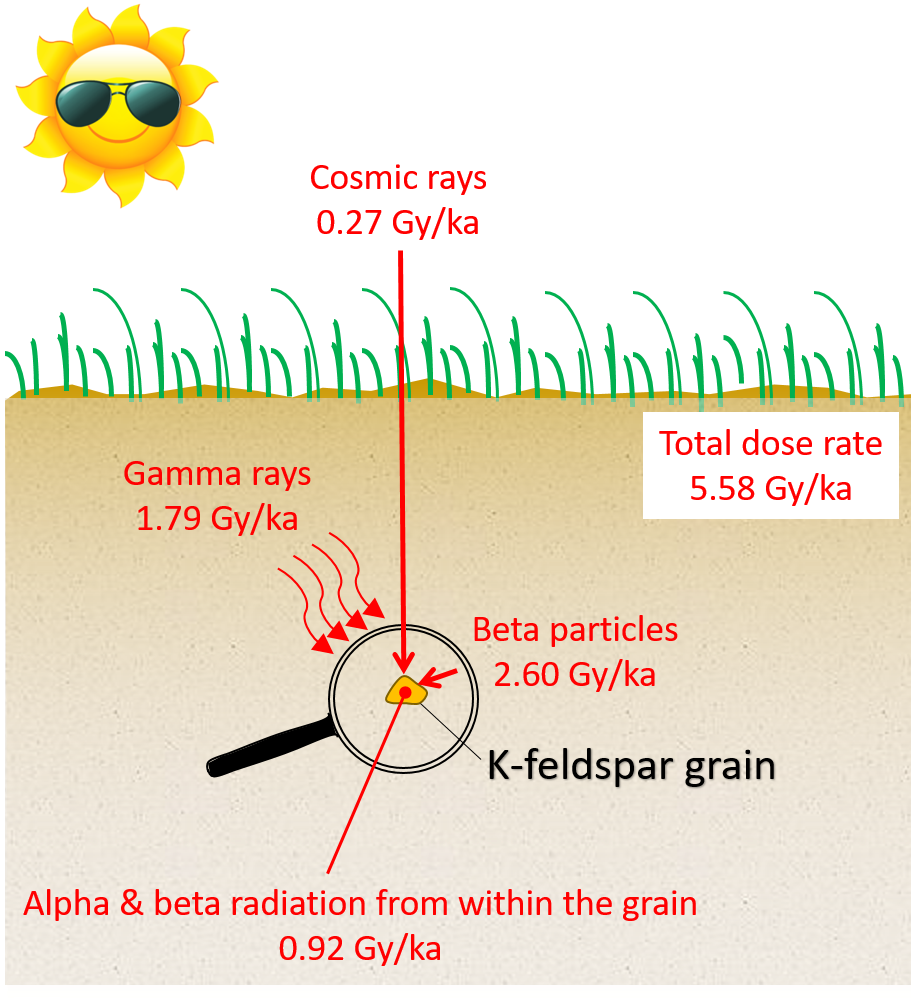
The sources of radiation and their measured dose rates for alluvial sediments (sample DDU011) collected 0.7 m below the surface in the southern Great Basin, USA. Because the grains were etched in HF acid, we can ignore the external alpha contributio…

The sources of radiation and their measured dose rates for alluvial sediments (sample DDU011) collected 0.7 m below the surface in the southern Great Basin, USA. Because the grains were etched in HF acid, we can ignore the external alpha contribution to the total dose rate.

Buried minerals absorb radiation from cosmic rays, gamma rays, beta particles and alpha particles, each penetrating the lithosphere to different extents.  Cosmic rays can penetrate sediments to several meters and attenuate by ~14% per meter of ~2 g/cm3 sediment.  Gamma rays can travel up to 30 cm, beta particles ~3 mm, and alpha particles, the most destructive particles of all, travel only ~25 µm (Aitken, 1998). 

A schematic illustrating the sources of radiation in the sampling environment and their approximate travel distances.

A schematic illustrating the sources of radiation in the sampling environment and their approximate travel distances.

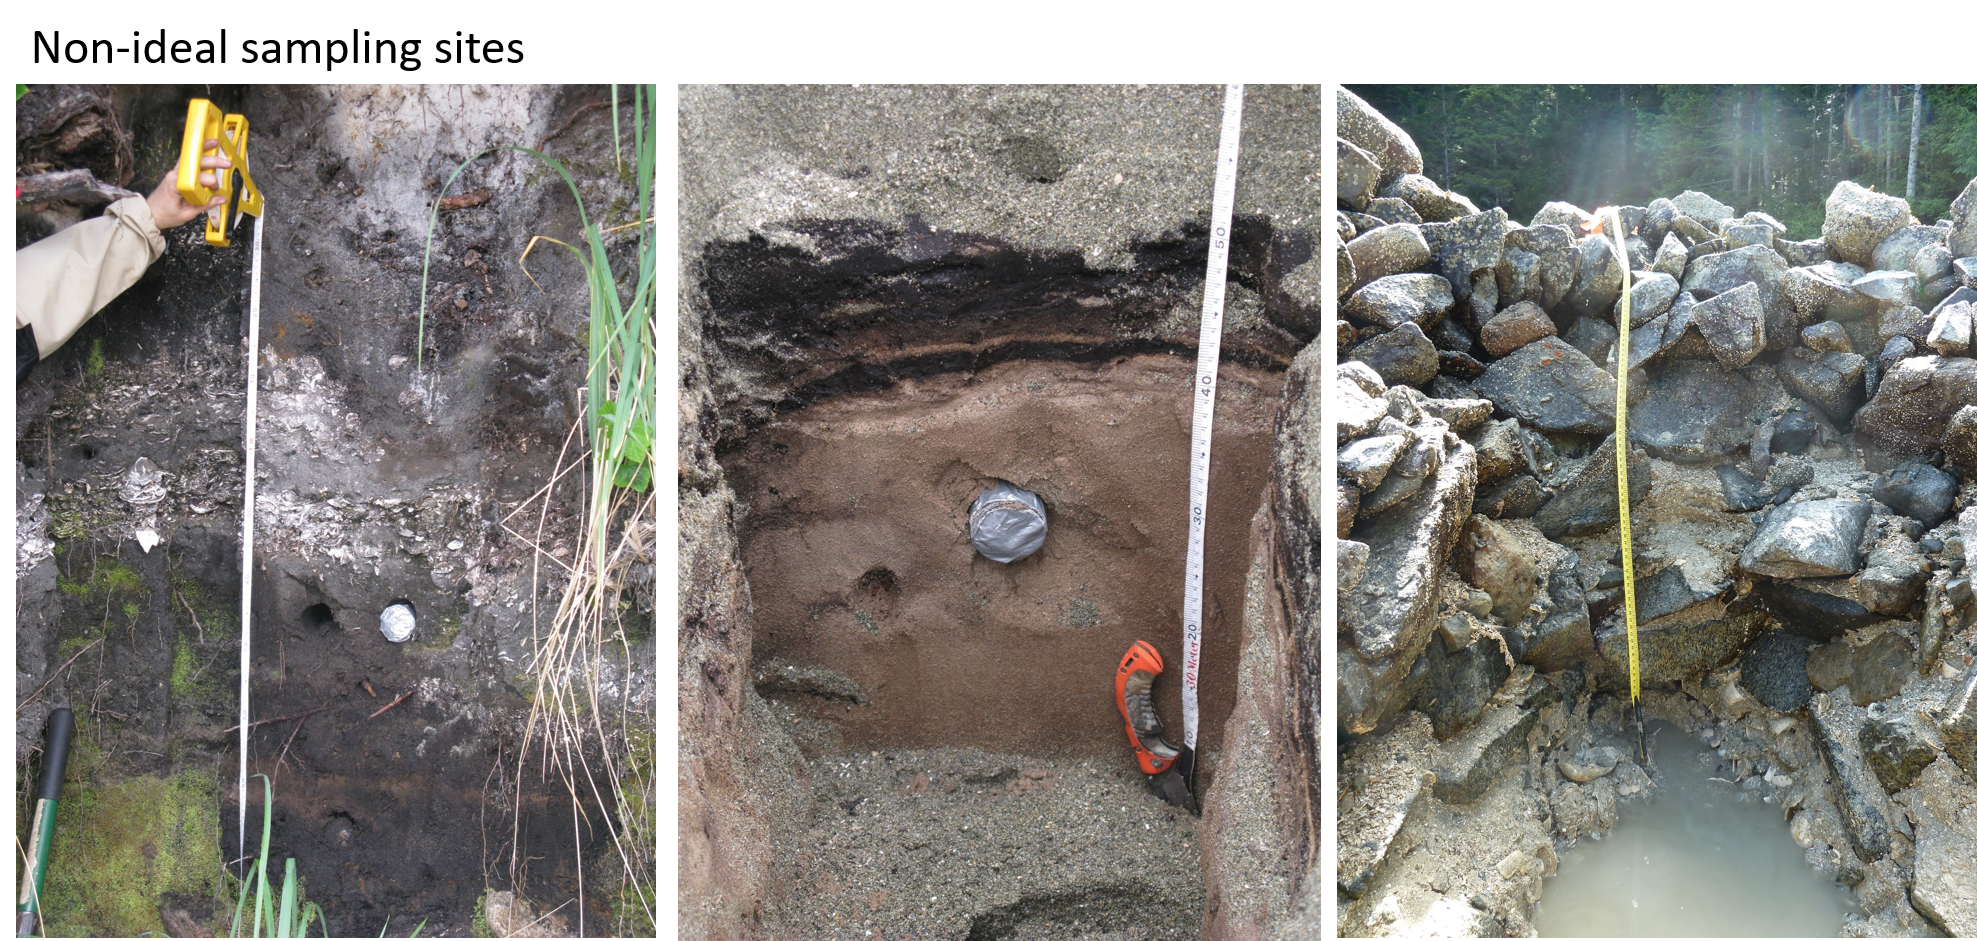
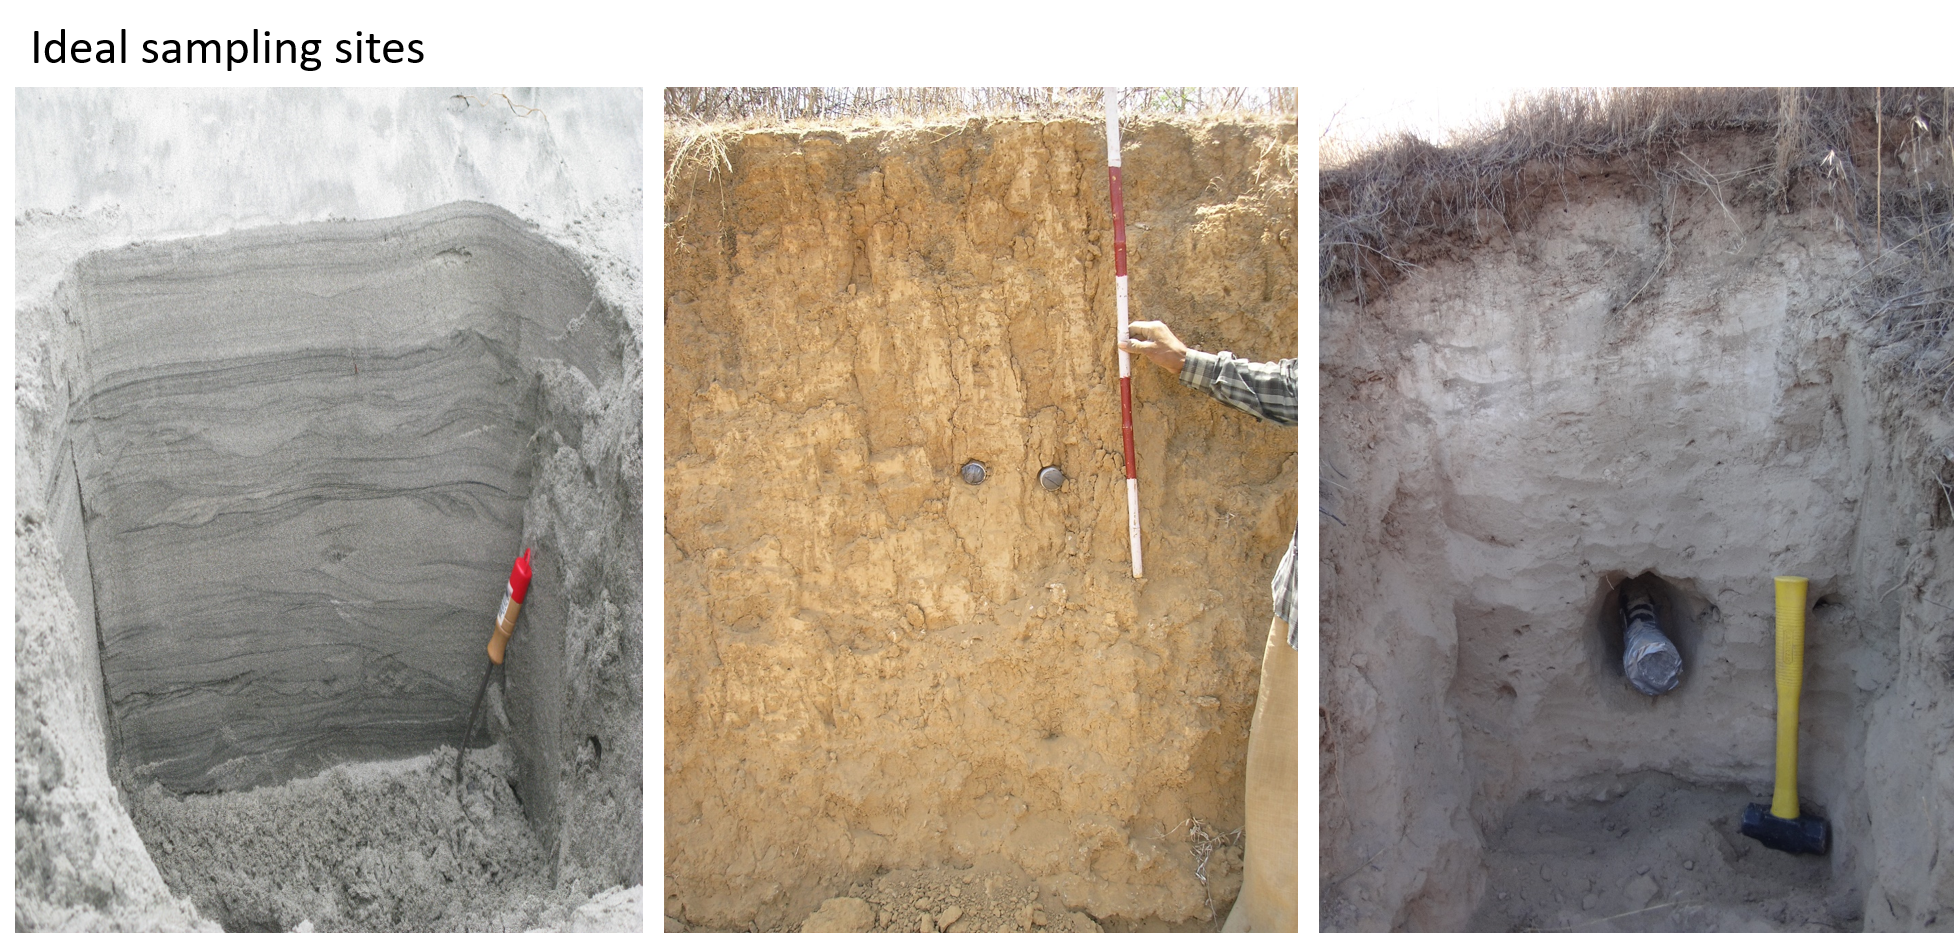
Because the sphere of influence of gamma rays is ~30 cm, we prefer to extract luminescence samples from areas where the composition and granulometry of the surrounding sediments is consistent (or homogeneous) within 30 cm of the sample.  If it is not, the dose rate that we measure from the sample may not accurately reflect the dose rate of the surrounding sediments. Examples of ideal and non-ideal sampling sites are shown below.

non-ideal.png
IDEAL.png

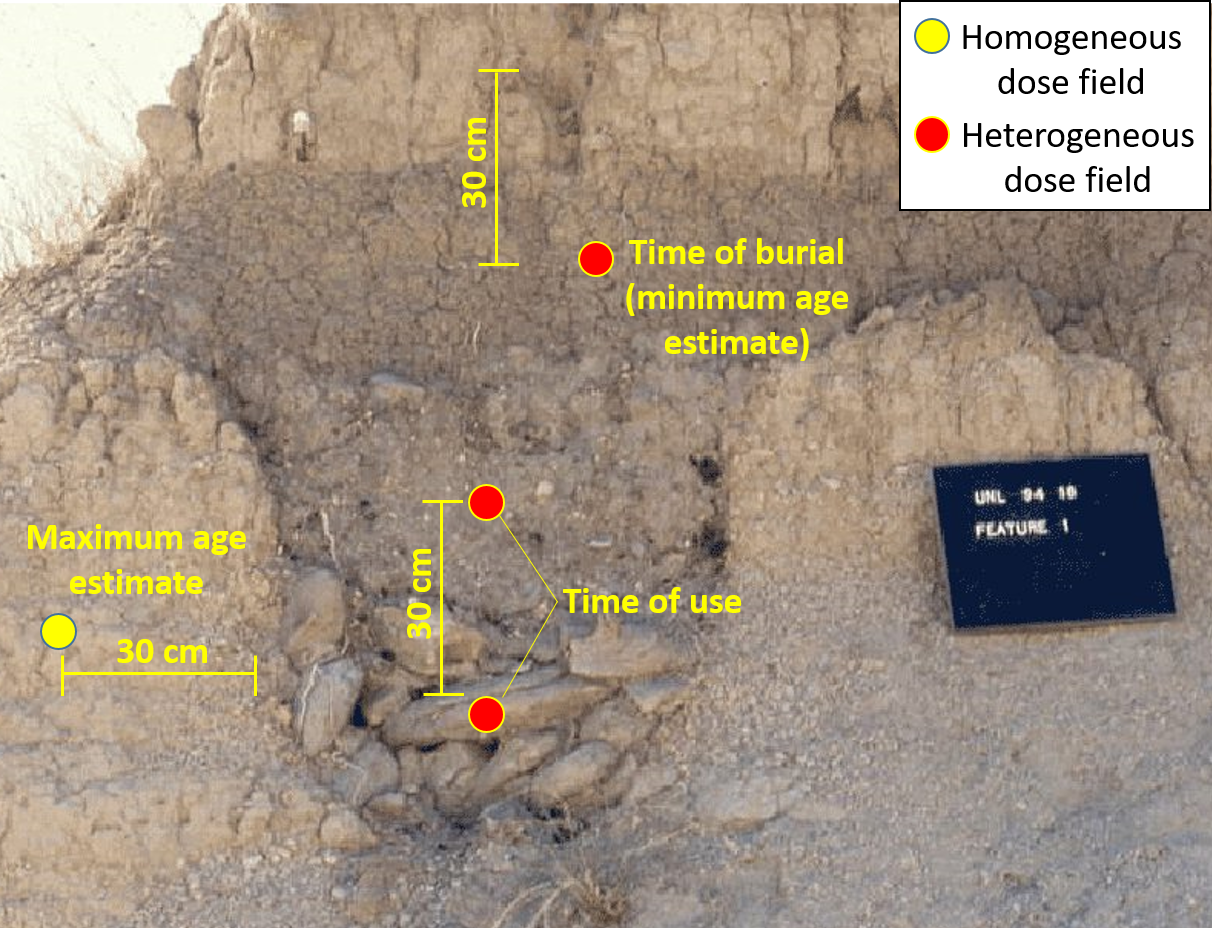
Often times, especially in archaeology, the feature we’d like to date does not provide a homogeneous dose field for sampling. In these cases, it’s necessary to: i) subsample individual lithostratigraphic layers/features within 30 cm of the sample site individually to estimate their dose rates so that the total dose rate of the sample can be modelled, and/or ii) measure the gamma dose rate to the sample directly in the field using a portable gamma spectrometer.

Possible sample sites (circles) for luminescence dating an earthwork ditch exposed in an archaeological trench at Garden Creek (Wright, 2011, “Earthwork Update” https://gardencreekarchaeology.wordpress.com/page/3/). The yellow circle shows a sample …

Possible sample sites (circles) for luminescence dating an earthwork ditch exposed in an archaeological trench at Garden Creek (Wright, 2011, “Earthwork Update” https://gardencreekarchaeology.wordpress.com/page/3/). The yellow circle shows a sample site where the gamma dose rate field is likely to be homogeneous. All other sample sites (red) are located in heterogeneous gamma dose rate fields. The 30 cm scale is hypothetical, and may not be accurate.

Possible sample sites (circles) for luminescence dating an escavated pit hearth in western Nebraska (Photo from the lesson plan by Damita Hiemstra, “Arner Site: Out of the Prairies of Western Nebraska”, http://d1vmz9r13e2j4x.cloudfront.net/nebstudie…

Possible sample sites (circles) for luminescence dating an escavated pit hearth in western Nebraska (Photo from the lesson plan by Damita Hiemstra, “Arner Site: Out of the Prairies of Western Nebraska”, http://d1vmz9r13e2j4x.cloudfront.net/nebstudies/Lesson4c_Arner.pdf). The yellow and red circles indicate homogeneous and heterogeneous gamma ray dose fields, respectively. The 30 cm scale is hypothetical, and may not be accurate.

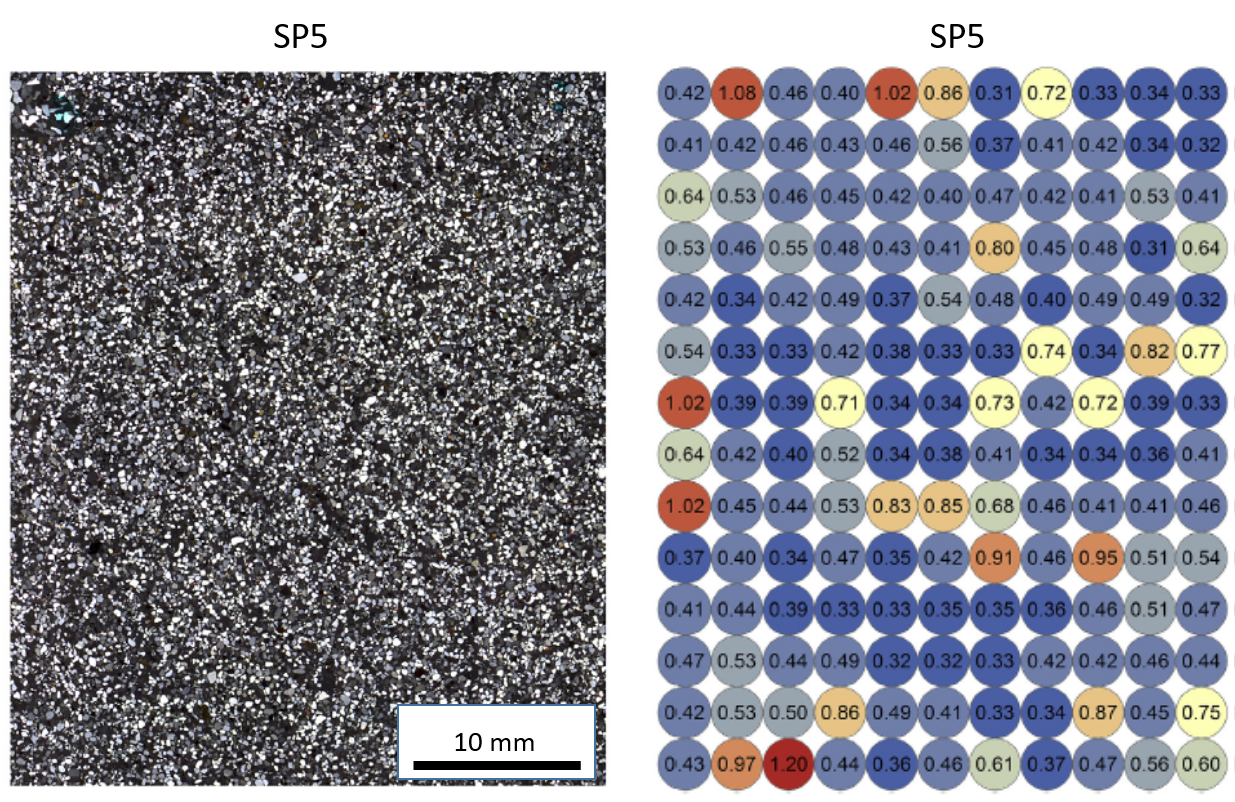
Heterogeneous dose fields are not only possible at the scale of a sedimentary exposure, but also at the scale of a thin section. This microscale heterogeneity is caused by spatial variations in beta dose rates, or “beta microdosimetry”. Spatial variations in K-40 concentrations (e.g., from K-feldspar grains) or U and Th in heavy minerals may lead to beta microdosimetry (e.g., Martin et al., 2015; Jankowski & Jacobs, 2018). This likely contributes to the spread (or overdispersion) of De and age distrubutions from single grains.

A) Stitched microphotograph of a thin section of beach sand from MacCauley’s Beach, NSW, Australia (sample SP5) shown in cross-polarized light. B) A beta dose rate (in Gy/ka) map created from portable XRF measurements of a separate impregnated block…

A) Stitched microphotograph of a thin section of beach sand from MacCauley’s Beach, NSW, Australia (sample SP5) shown in cross-polarized light. B) A beta dose rate (in Gy/ka) map created from portable XRF measurements of a separate impregnated block of the same sample. The spatial variations in beta dose rate in this sample can explain the spread in De values (overdispersion = 35%) measured from 170 individual grains (Jankowski & Jacobs, 2018).

Sampling for luminescence dating - Part I

Samples for luminescence dating can be collected in a myriad of ways, and can include different types of material. Materials most commonly dated are grains of sand or silt, however pottery, rock surfaces, rock art, and even archaeological constructions, such as walls and buildings have also been sampled.

Because luminescence dating methods determine the last time a mineral has been exposed to light or heat, it is imperative that light or heat is not introduced to the sample during the sampling process. This can be tricky! Below we list some common, and not so common ways of collecting luminescence samples. Stay tuned for upcoming blogs that delve into more details about the sampling process.

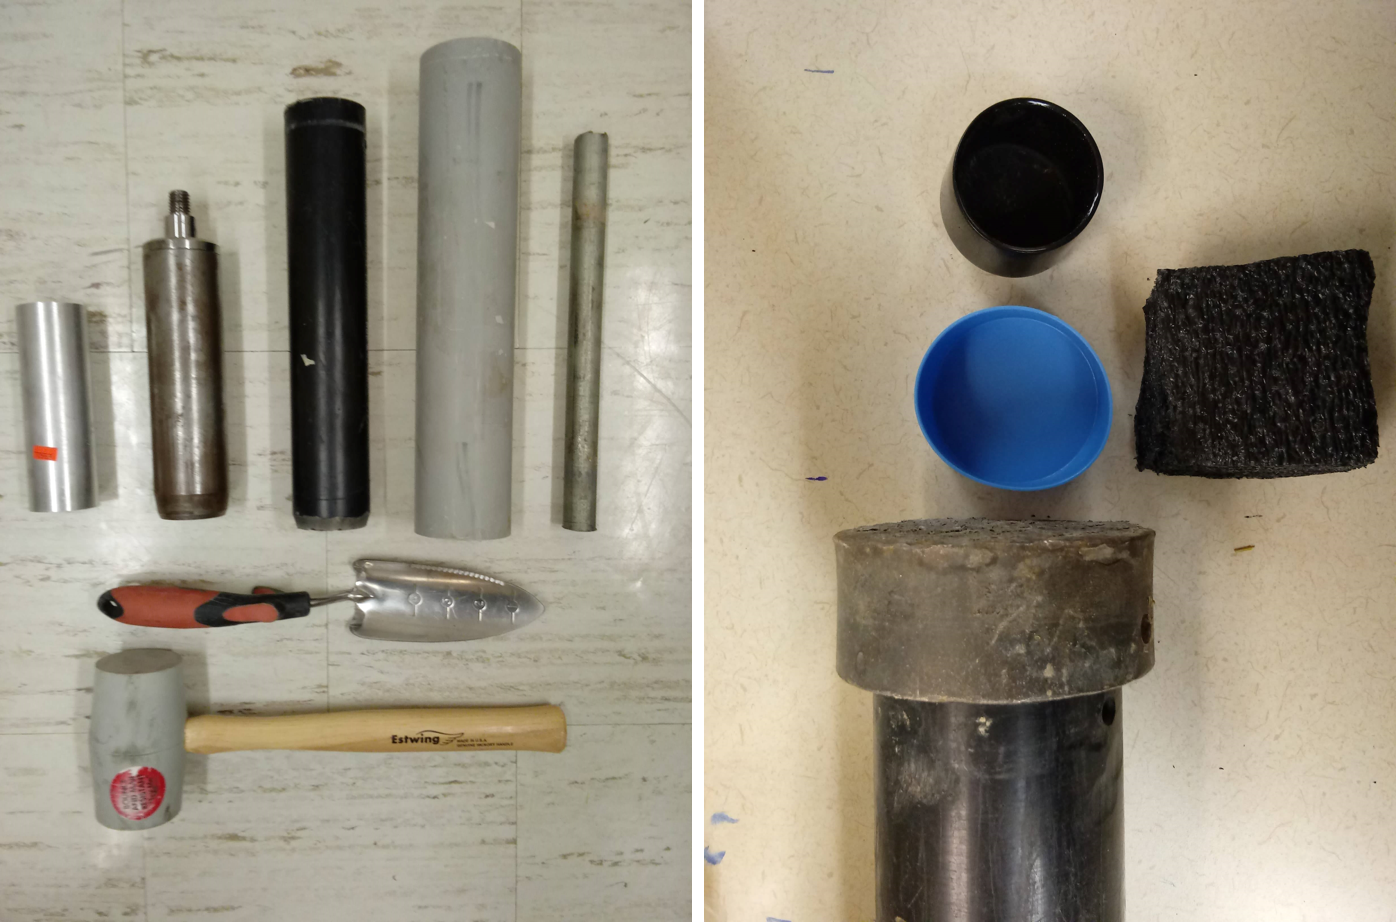
1) Sampling tubes. This is the most common method of collecting a luminescence sample from sediments. Sampling tubes are typically hammered into a sedimentary exposure, or the side of an archaeological trench, to collect sediments from the sedimentary unit or archaeological layer of interest.

OSL_tube.png

Before hammering, the tube may be stuffed with foam, plastic or paper. After the tube is fully inserted, it is then excavated back out, and the light-exposed ends are sealed with opaque plastic, tape or a cap. The size of the tube you use, will depend on the thickness of the unit/layer you are sampling, and how much time you think it took for the sediment to accumulate. To avoid obtaining an imprecise age, tubes of smaller diameter should be used for sedimentary units thought to have accumulated over long periods of time.

Luminescence sample tubes of various sizes (LEFT). A steel cap may be placed on the end of the tube to protect it during hammering (RIGHT), and the tube ends can be sealed with a cap, opaque plastic or tape. Sample tubes are commonly stuffed with a …

Luminescence sample tubes of various sizes (LEFT). A steel cap may be placed on the end of the tube to protect it during hammering (RIGHT), and the tube ends can be sealed with a cap, opaque plastic or tape. Sample tubes are commonly stuffed with a paper, plastic or foam “plug” (RIGHT) prior to hammering the tube into the sediments. This ensures that the sediments remain compact, minimizing any mixing between sun-exposed grains and non-exposed grains during transport. If a sample is collected subaqueously, it is not advisable to use a plug, as this may force sediment-laden water back out the unplugged end, contaminating non-light-exposed sediments.

2) A hand auger. Luminescence samples can be collected using an auger equipped with a light-tight core sampler, allowing us to target sediments several meters below the surface.

Luminescence sampling by hand auger (LEFT). A beveled, light-tight core sampler (RIGHT). Photo credits: Amanda Keen-Zebert (left), christina neudorf (right)

Luminescence sampling by hand auger (LEFT). A beveled, light-tight core sampler (RIGHT). Photo credits: Amanda Keen-Zebert (left), christina neudorf (right)

3) Coring. Luminescence samples can be extracted from sediment cores that have been collected by hand, by percussion coring, or by vibracoring. If cores are collected from loose or saturated sediments, a core catcher maybe placed at the penetrating end of the core to prevent sediment from falling back out during extraction.

Sediment cores collected by hand using ABS pipe (LEFT). ABS pipe is less prone to fracture than PVC pipe, especially in rocky substrates. Cores may be extracted using a tripod and winch system (LEFT-CENTER). A core catcher (RIGHT-CENTER & RIGHT)…

Sediment cores collected by hand using ABS pipe (LEFT). ABS pipe is less prone to fracture than PVC pipe, especially in rocky substrates. Cores may be extracted using a tripod and winch system (LEFT-CENTER). A core catcher (RIGHT-CENTER & RIGHT) can prevent the loss of sediment during core extraction. pHOTO CREDITS: CHRISTINA NEUDORF

In a light-safe lab, multiple luminescence samples can be extracted from a single core to construct “age vs depth” profiles.

Core sample sediments in a light-safe lab, ready for subsampling for luminescence dating AT THE UNIVERSITY OF THE FRASER VALLEY. PHOTO CREDIT: CHRISTINA NEUDORF

Core sample sediments in a light-safe lab, ready for subsampling for luminescence dating AT THE UNIVERSITY OF THE FRASER VALLEY. PHOTO CREDIT: CHRISTINA NEUDORF

4) Block samples. When luminescence sample tubes cannot penetrate extremely cohesive sands or silts, it may be necessary to extract a block sample. This can be done using a rock hammer or saw. After sampling, the block is wrapped tightly in opaque plastic, then shipped in containers with sufficient cushioning (e.g., bubble wrap) to prevent the block from cracking during transport. Once in the light-safe lab, the outer-most sediments are carefully carved away from the block before the inner, non-light-exposed sediments are processed for dating.

A block sample collected from cohesive sandy silts along the Snake River, Idaho. PHOTO CREDITS: TOM BULLARD

A block sample collected from cohesive sandy silts along the Snake River, Idaho. PHOTO CREDITS: TOM BULLARD

5) Under a tarp, or at night. If light contamination cannot be prevented using sampling tubes or cores, a sample may be collected under an opaque tarp and/or at night. Finding tarp material that is truly light-safe can be tricky, and multiple layers may be necessary. As always, the sample must be packaged in such a way that any surface sediments that were exposed to the sun during the day do not contaminate the non-light-exposed sediments.

Luminescence sampling under a tarp IN NEWFOUNDLAND, CANADA. Tape was applied to creases susceptible to light penetration, and multiple layers of material was used. If you choose to sample this way, do it quickly and with lots of helping hands - You …

Luminescence sampling under a tarp IN NEWFOUNDLAND, CANADA. Tape was applied to creases susceptible to light penetration, and multiple layers of material was used. If you choose to sample this way, do it quickly and with lots of helping hands - You do not want to suffocate! PHOTO CREDIT: GREGORY MUMFORD

6) Rock surface sampling. The surfaces of boulders or cobbles can be sampled for luminescence dating by coring and slicing (e.g., Freiesleben, et al., 2015; Jenkins et al., 2018). Rock surface dating has also been applied to rock art (e.g., Liritzis et al., 2018). Cores can be extracted using a hand drill with a diamond-tipped drill core, then sliced into sub-centimeter thick slices using a microsaw or wafering blade. A water cooling system for both the core and saw may be necessary to prevent the sample from heating up due to friction. Rock slices may be crushed and prepared as sediment samples prior to measurement, or measured directly.

Rock surface sampling steps for luminescence dating. the ~9 mm diameter rock core was extracted from a granite boulder from Quadra Island, British Columbia, Canada. The rock slice is from granite sampled by Meyer et al. (2018). Slices can then be mo…

Rock surface sampling steps for luminescence dating. the ~9 mm diameter rock core was extracted from a granite boulder from Quadra Island, British Columbia, Canada. The rock slice is from granite sampled by Meyer et al. (2018). Slices can then be mounted into a luminescence reader and measured directly as shown by Freiesleben (2014) (FAR RIGHT).

7) Brick or stone structures and monuments. Pieces of archaeological structures can be sampled by chiselling, coring, or, in the case of limestone structures, acid treatment prior to the extraction of quartz inclusions (e.g., Bailiff, 2007; Liritzis, 2010; Stella et al., 2014).

Drill core sampling brick from a late-Post medieval English building (Bailiff, 2007) (TOP). Method of sampling a megalithic wall (shown is Mykerinus pyramid, Egypt) (BOTTOM) (Liritzis, 2011).

Drill core sampling brick from a late-Post medieval English building (Bailiff, 2007) (TOP). Method of sampling a megalithic wall (shown is Mykerinus pyramid, Egypt) (BOTTOM) (Liritzis, 2011).

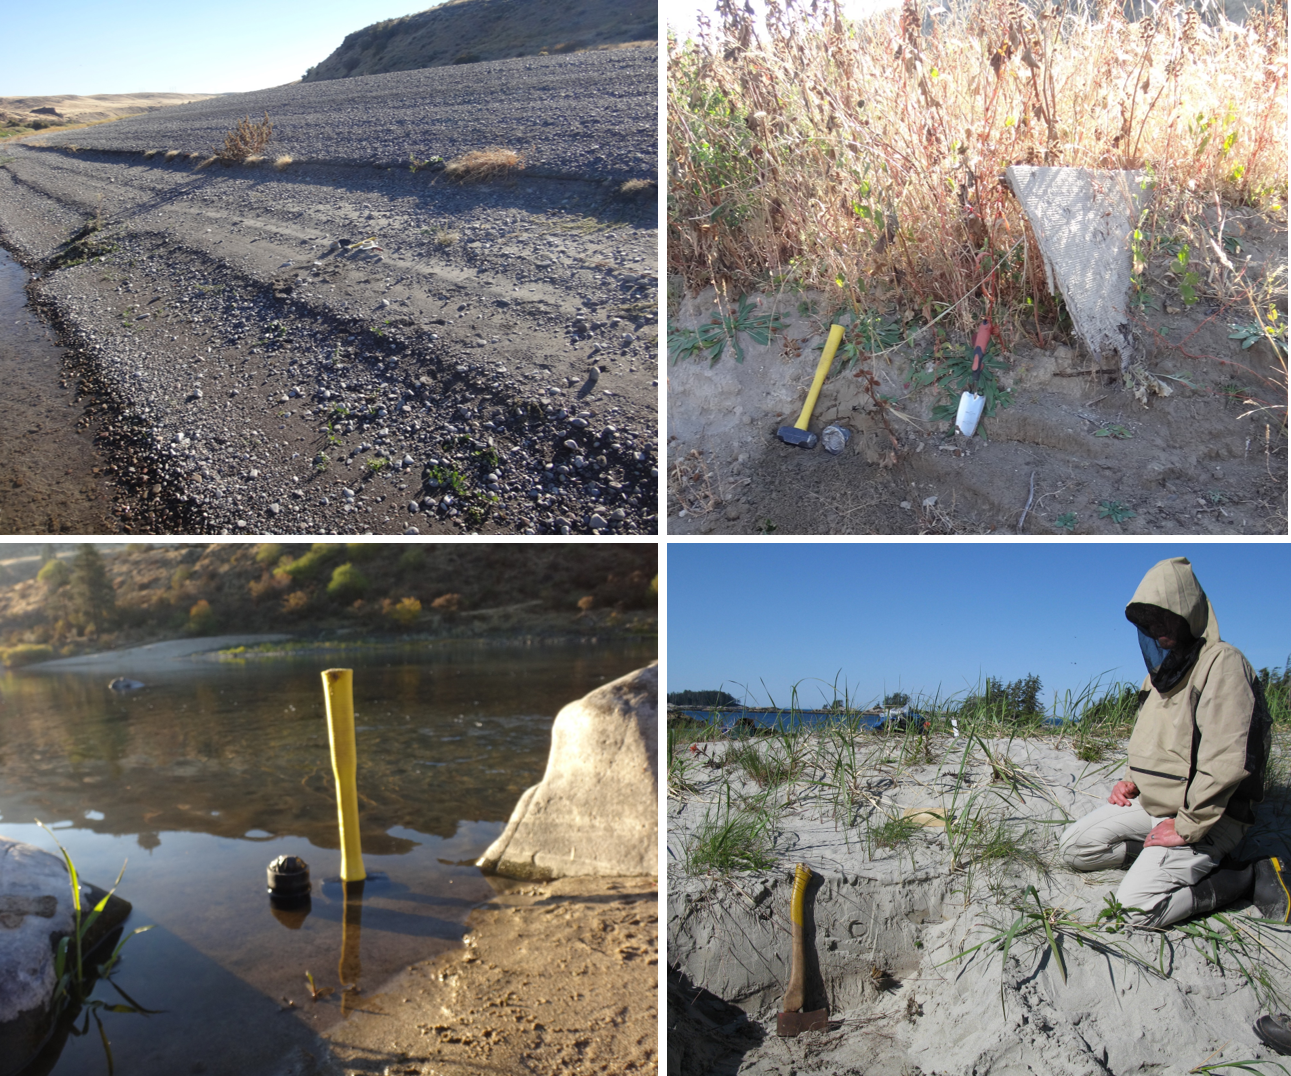
In most cases, it is desirable to collect a “modern” sample to check how well the luminescence signal is re-set during sun-exposure. This allows us to evaluate ages from our ancient samples, by determining the likelihood that their signals were also fully re-set prior to burial. The modern sample should be collected from rocks or sediments that have experienced the same mode of transport and deposition as the ancient samples. Unfortunately, even when this is the case, there is always the possibility that the bleaching history of the modern sample will not be representative of the ancient samples collected at the same site.

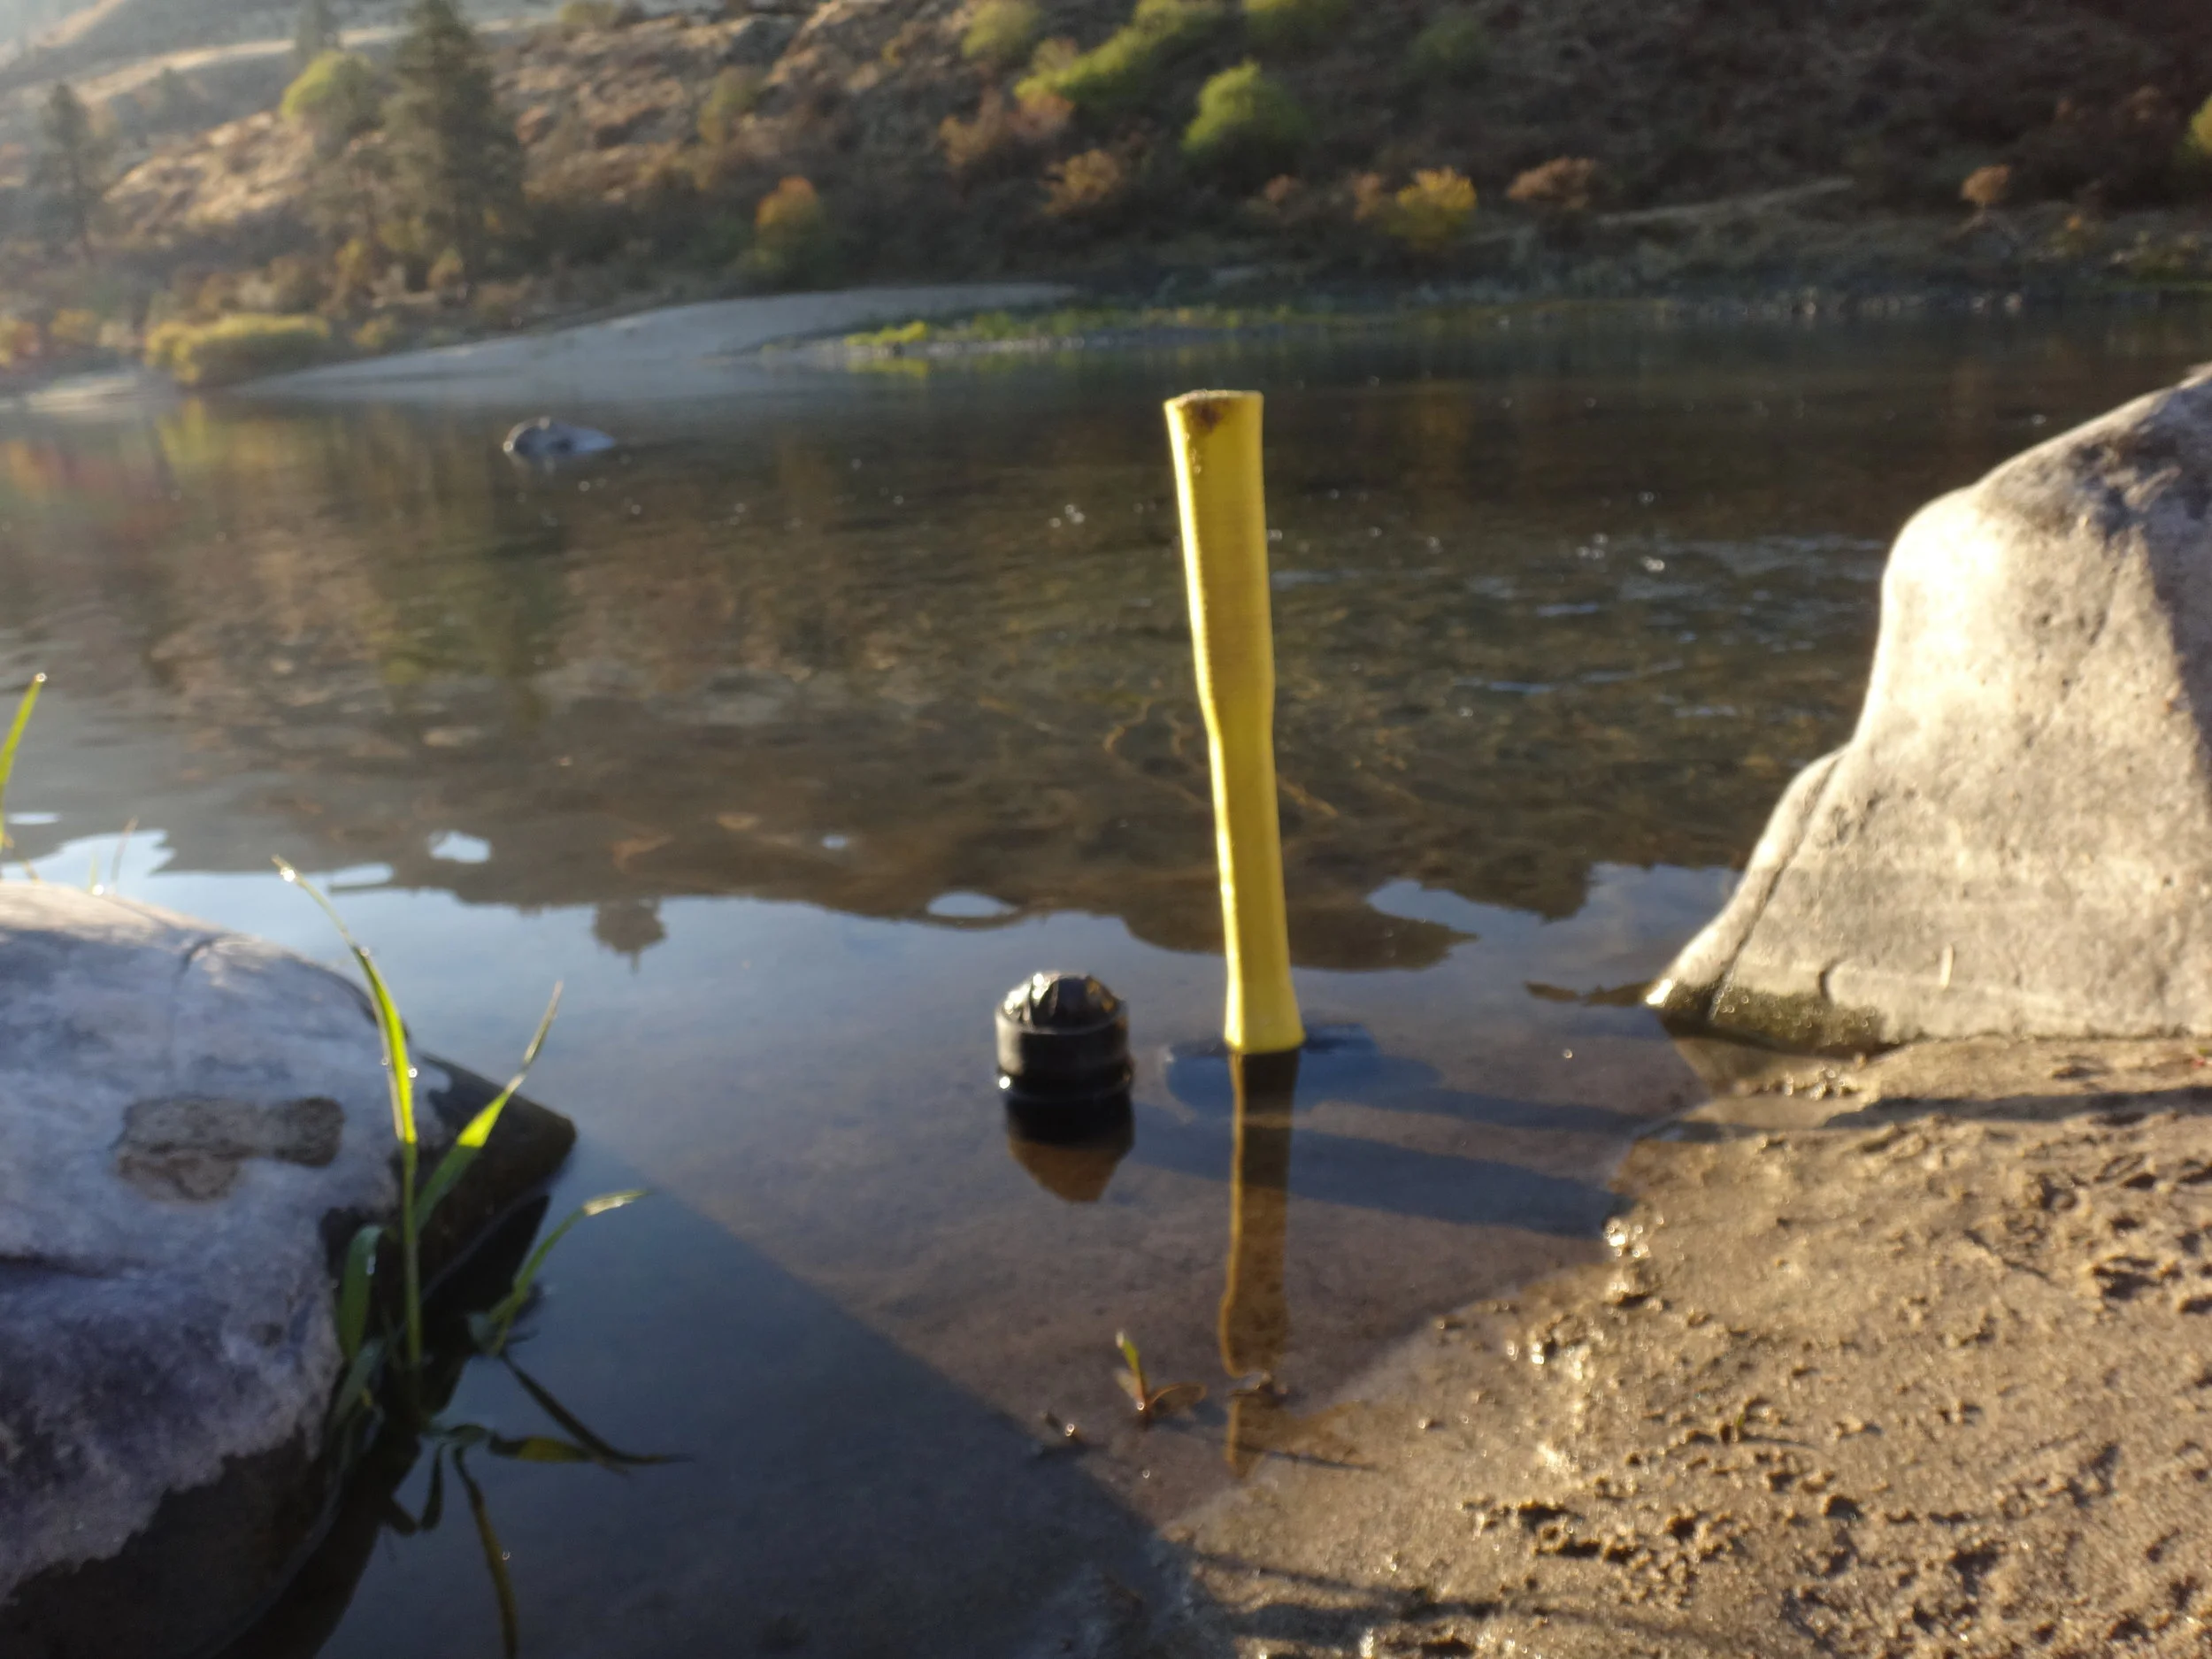
Modern samples should be collected at sites with bleaching conditions thought to be representative of the ancient samples of interest. (TOP LEFT) A modern sandy gravel bar in the Snake River, Idaho. (TOP RIGHT). A vegetated sand bar in the Snake Riv…

Modern samples should be collected at sites with bleaching conditions thought to be representative of the ancient samples of interest. (TOP LEFT) A modern sandy gravel bar in the Snake River, Idaho. (TOP RIGHT). A vegetated sand bar in the Snake River, Idaho. (BOTTOM LEFT) Shallow-water river sediments adjacent to an archaeological site in Idaho. PHOTO CREDITS: CHRISTINA NEUDORF. (BOTTOM RIGHT) The crest of a sand dune on Calvert Island, British Columbia. PHOTO CREDIT: OLAV LIAN

What is overdispersion?

A luminescence age from a sample is typically calculated from a distribution of ages measured from multiple individual grains or multi-grain aliquots from that sample.

The overdispersion of the De distribution (commonly abbreviated “OD” or “σ”) represents the “spread” in the distribution that remains after all measurement errors specific to each grain/aliquot (also known as the “within-aliquot variation”) have been taken into account (Galbraith and Roberts, 2012).  Below, we show an example of a sample with low OD, and a sample with high OD.

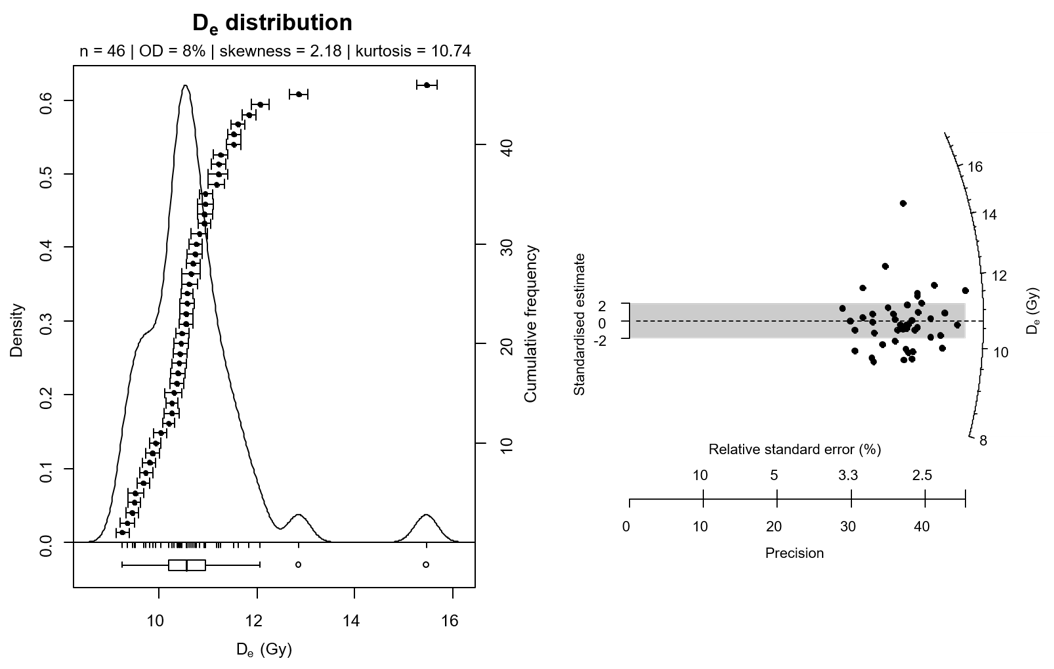
A De distribution, exhibiting a relatively low (<10%) OD, plotted as a kernel density estimate (KDE) (LEFT) and a radial plot (RIGHT). Two high outlying De values suggest that some grains may contain a residual signal prior to burial, however the…

A De distribution, exhibiting a relatively low (<10%) OD, plotted as a kernel density estimate (KDE) (LEFT) and a radial plot (RIGHT). Two high outlying De values suggest that some grains may contain a residual signal prior to burial, however the low OD value, and symmetrical shape of the De distribution between ~3 and ~12 Gy suggest that the majority of grains have been well bleached prior to burial and that heterogeneities in the environmental dose rate field at the sample site are minimal. Grey shading in the radial plot marks ±2σ of the Central Age Model De value (10.2 Gy). Note that most grains fall within this shaded region. Click here for details on how to read a radial plot.

A De distribution, exhibiting a high (&gt;30%) OD, plotted in a kernel density estimate (KDE) plot (LEFT) and a radial plot (RIGHT). The asymmetry of the distribution suggests partial bleaching. Grey shading in the radial plot marks ±2σ of the Centr…

A De distribution, exhibiting a high (>30%) OD, plotted in a kernel density estimate (KDE) plot (LEFT) and a radial plot (RIGHT). The asymmetry of the distribution suggests partial bleaching. Grey shading in the radial plot marks ±2σ of the Central Age Model weighted mean De value (27.5 Gy), and the solid line marks the younger Minimum age model De value (19.2 Gy). Note that few grains fall within 2σ of the CAM weighed mean De value. Click here for details on how to read a radial plot.

When σ is non-zero or high, we may infer that:

i)                  some grains have been insufficiently bleached prior to deposition,

ii)                 there has been mixing between sedimentary layers of different ages, and/or

iii)                there are grain-to-grain variations in environmental dose rate not taken into account in our dose rate estimate.

Sources of error in luminescence dating... Some specifics on the fuzzies...

When interpreting and evaluating luminescence ages of a landform or archaeological site, it’s important to consider sources of error. The main sources of error include:

1)      Measurements of luminescence signal intensity. In short, the brighter the signal, the lower the error associated with signal intensity (Duller, 2007). Quartz from mountainous regions dominated by granitic rocks commonly has dim signals (Neudorf et al. 2015; 2017), whereas feldspars typically have brighter signals. The intensity of the luminescence signal, also known as “sensitivity”, is thought to be higher in minerals that have experienced multiple episodes of erosion, transport and deposition over time (Fitzsimmons et al., 2010; Fitzsimmons, 2011; King et al., 2011).  Australian quartz, derived from ancient mature sandstones, has some of the brightest luminescence signals in the world.

lightsource.png

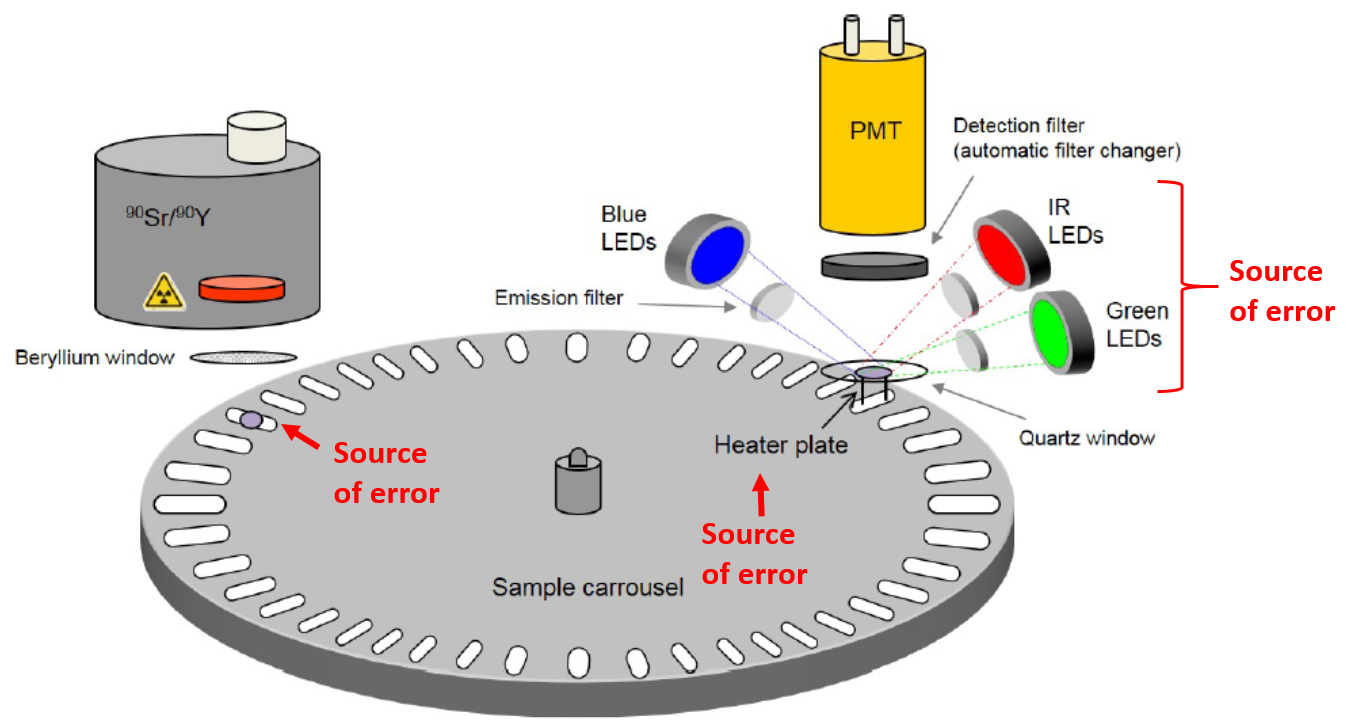
2)      Instrumental error associated with the equipment used for De measurement. This error results from variations in aliquot positioning on the reader carousel during heating, radiation and stimulation. It is also derived from small fluctuations in the brightness of the stimulation source. Instrumental error varies from reader to reader, but commonly equates to ~1-3% (e.g., Armitage et al., 2000; Thomsen et al., 2005; Jacobs et al., 2006b, Rodnight, 2006), and can be measured in the lab.

The components of a luminescence dating reader, modified from Fig. 1.1 of “Guide to The Risø TL/OSL Reader” (July, 2017). Sources of instrumental error include aliquot positioning on the sample carousel and on the heating plate, variations in heatin…

The components of a luminescence dating reader, modified from Fig. 1.1 of “Guide to The Risø TL/OSL Reader” (July, 2017). Sources of instrumental error include aliquot positioning on the sample carousel and on the heating plate, variations in heating rates, and fluctuations in brightness of the LED or laser stimulation sources.

3) For single-grain measurements on single-grain discs, grain-to-grain variations in administered doses due to a non-uniform radiation field in the luminescence reader. Radiation sources in luminescence readers rarely have a perfectly uniform radation field, but this can be corrected for in the laboratory.

A contour plot of the relative dose rate over a 10 x 10 mm single-grain disc irradiated in a luminescence reader at DRI. Correction factors generated from these data are used to correct single-grain data measured on this machine for non-uniform beta…

A contour plot of the relative dose rate over a 10 x 10 mm single-grain disc irradiated in a luminescence reader at DRI. Correction factors generated from these data are used to correct single-grain data measured on this machine for non-uniform beta irradiation.

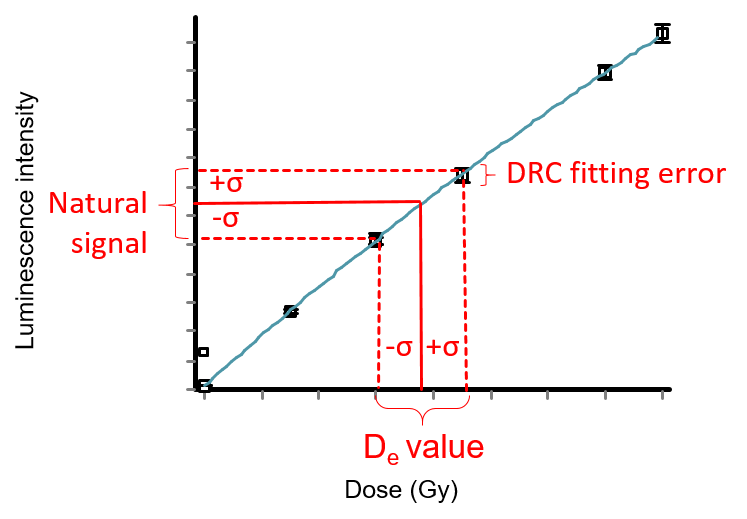
4)      Dose response curve (DRC) fitting error.  Dose response curves are used to determine a sample’s response to laboratory-given doses (aka regeneration doses) in the lab, in order estimate the true (natural) dose (De) of the sample. Due to instrumental error and error associated with luminescence signal intensity, regeneration dose points will also have error, and these will contribute to the total error associated with fitting the curve to the points (Duller, 2007).  

DRC-error2.png

5)      Systematic failures in the measurement protocol and/or sediment optical properties that do not work well with the measurement procedure. Grains or multi-grain aliquots that show aberrant behavior are typically rejected from further analysis to reduce this error.

KFaliquot.jpg

6)      Errors associated with dose rate measurement or the measurement of the concentration of radionuclides in the sample burial environment. These errors are dependent on the methods of measurement (e.g., neutron activation analysis, high-resolution gamma spectroscopy, in situ gamma spectroscopy, etc.).

gammaspec.jpg

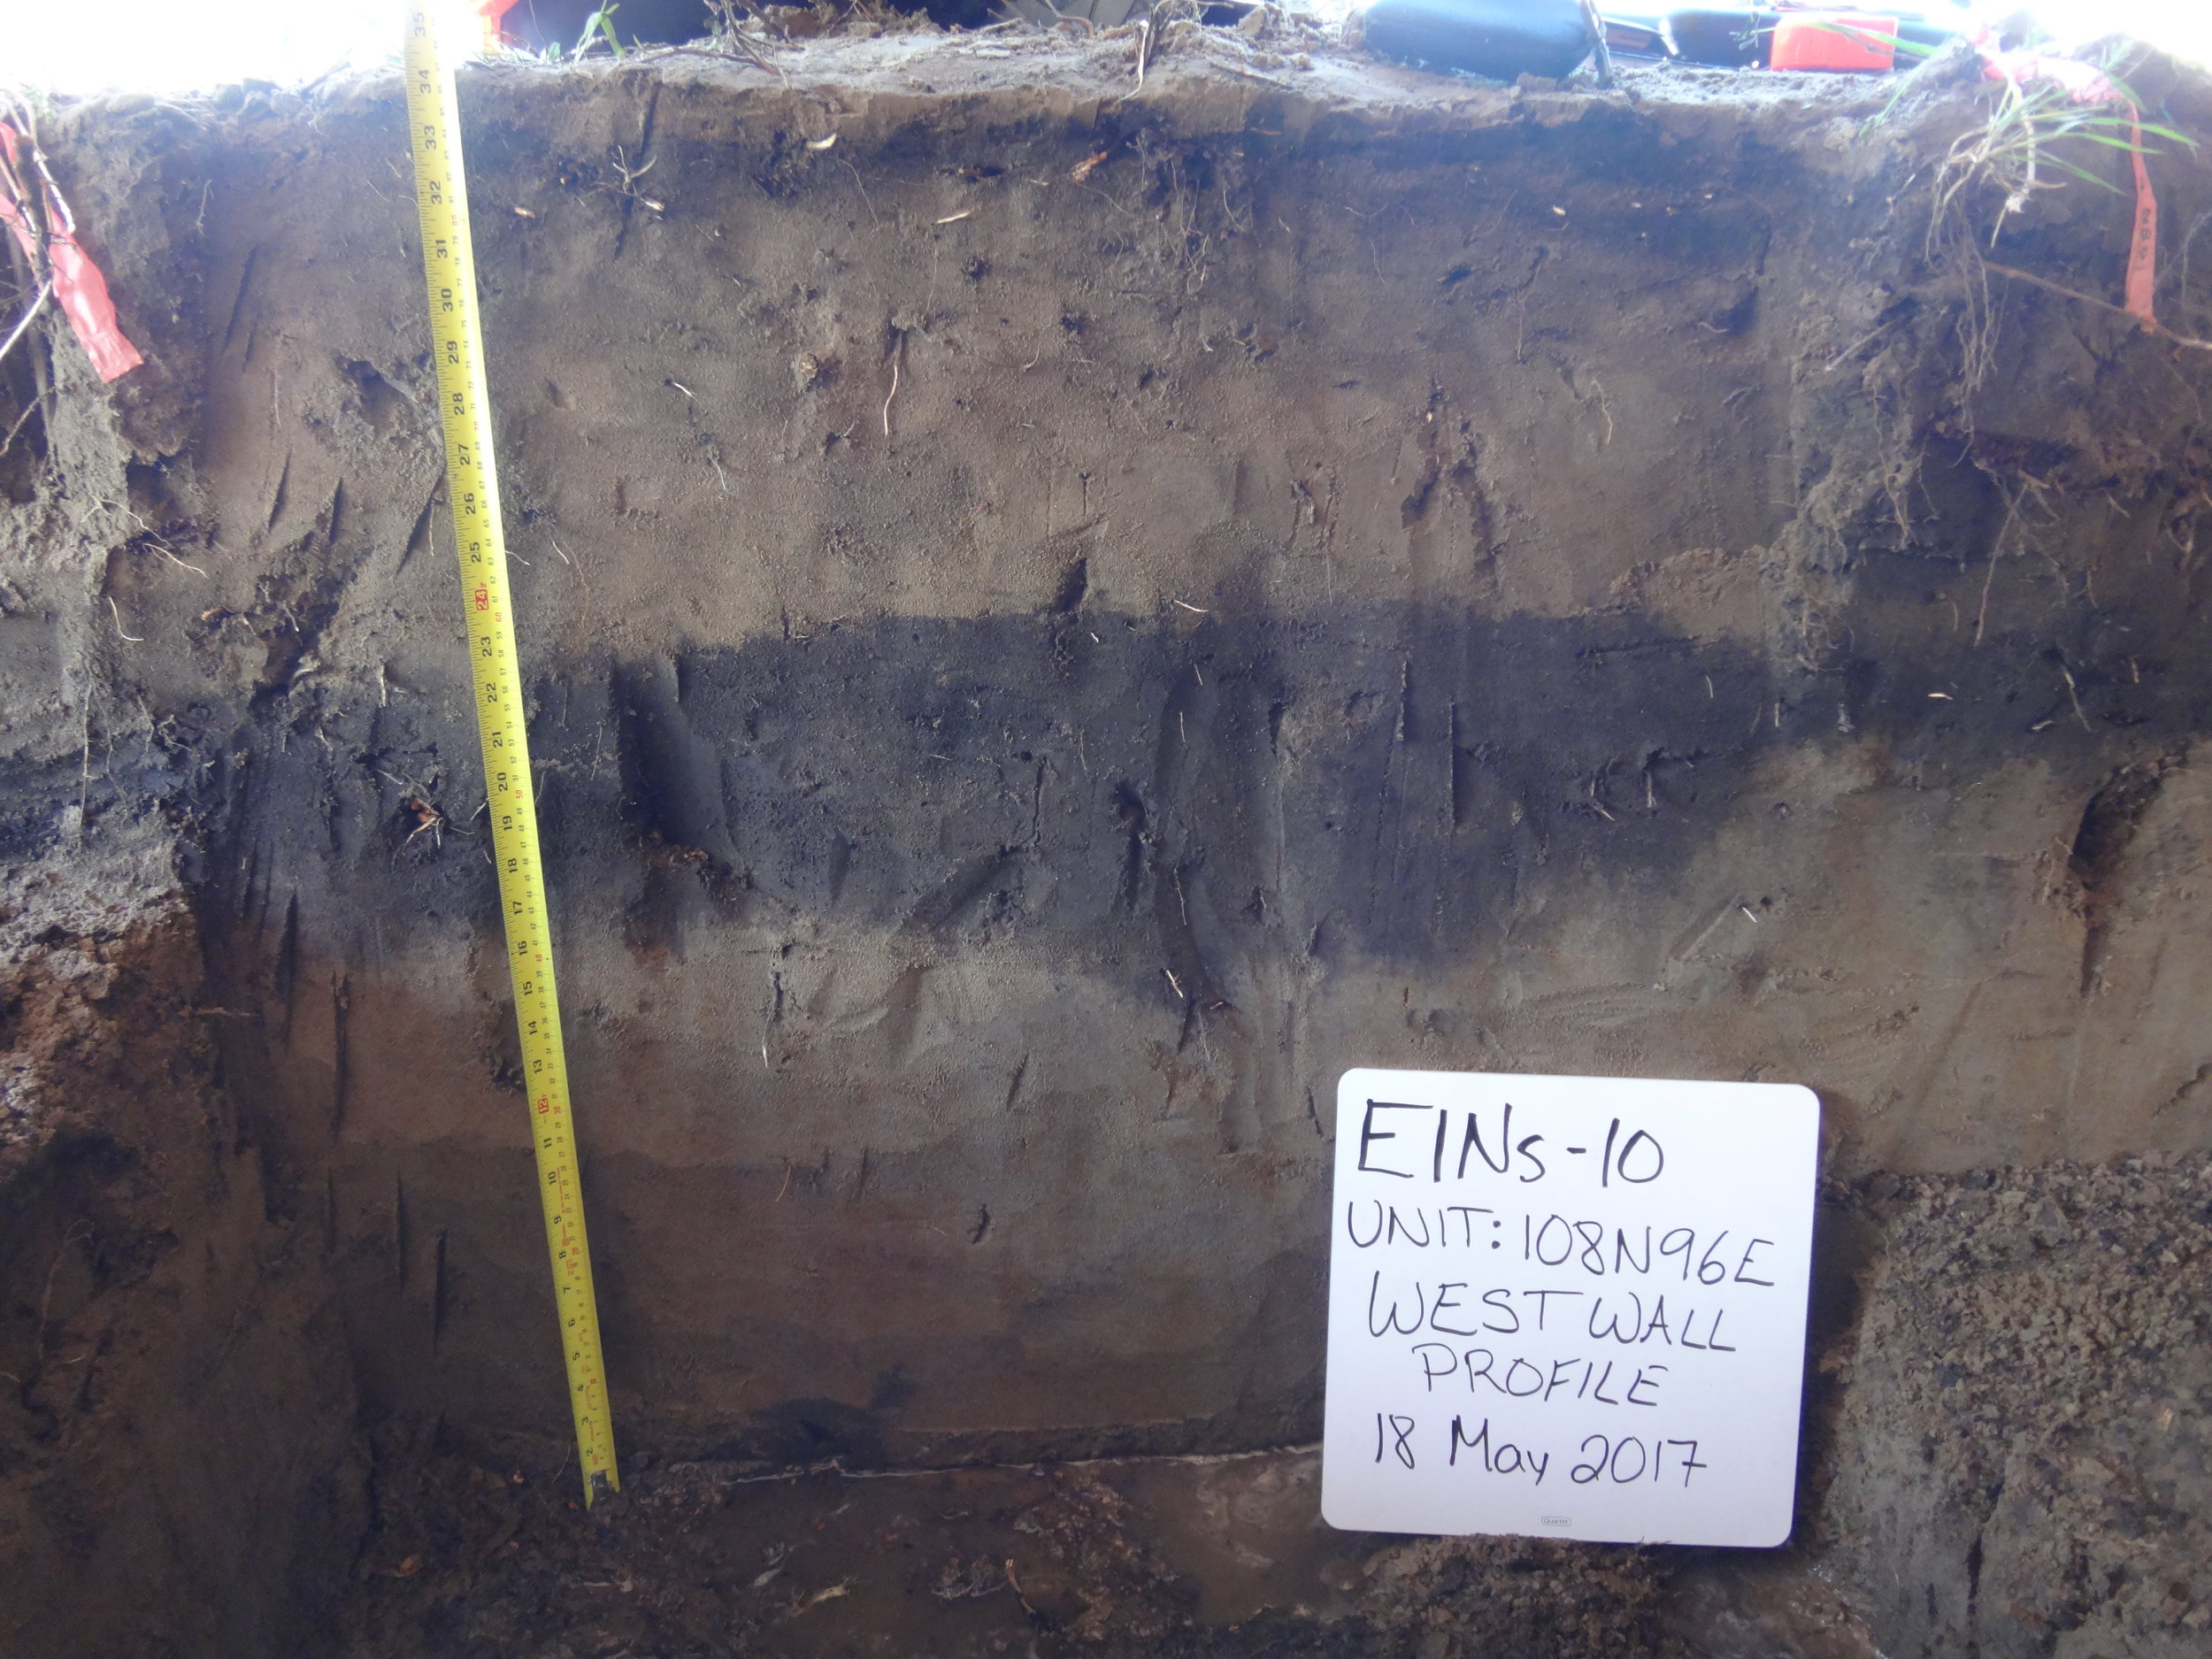
7)      Errors that must be approximated subjectively. This often include assumptions regarding the burial environment that effect the rate of radiation the sample has received throughout its burial history. Has the water content fluctuated? Has organic material that uptake radionuclides accumulated or disappeared? Has the sedimentation rate changed? Has pedogenesis altered the sediments? These sources of error are best evaluated when we collect detailed sedimentological and geomorphological observations in the field.

108N96E-WestWall-c.JPG

Of course, the precision with which a luminescence age can be measured may not reflect its accuracy. For example, extremely precise De and age estimates can be made on very bright minerals from homogeneous sediments with well defined dose rates. But if the signals of these grains were not completely re-set prior to final deposition, their measured age may be an over-estimate. Seemingly precise luminescence ages may also be inaccurate if the dose rate of the burial environment has changed through time. Thus the error and assumptions associated with all components of a luminescence age need to scrutinized carefully to determine the chronology of a site.

How accurate is an optical age?

A common question geoscientists and archaeologists have is, how accurate are luminescence ages? Under ideal conditions (e.g., bright optical signals that are optimal for the measurement protocol used in the lab, and well-constrained dose rate histories) the error of an optical age can be 10% of the age or less. 

Relative errors in optical ages, however, can be harder to minimize in young (e.g., <1000 years) sediments than they are in older (Mid-late Pleistocene) samples.  This is largely because younger samples i) tend to have dim signals, ii) can be more adversely effected by temporal and spatial variations in the dose rate field during burial, iii) are more sensitive to incomplete re-setting of the optical signal during sediment transport and burial, and iv) are particularly sensitive to heating treatments applied in the laboratory during De measurement (Madsen & Murray, 2009).

Optical ages vs their relative errors for young (&lt;1000 yrs) and older (Mid-late Pleistocene) sediments. The highest relative errors are commonly associated with sediments of ~100 years in age or less.

Optical ages vs their relative errors for young (<1000 yrs) and older (Mid-late Pleistocene) sediments. The highest relative errors are commonly associated with sediments of ~100 years in age or less.

So, in the most ideal cases, late-Holocene optical ages may have errors of ±100-500 years, whereas mid-Pleistocene sediments that are ~200-300 ka in age may have errors of ±15-20 ka.  If a sample was deposited within the last 500 years or so, absolute errors in the order of decades or less can be achieved.

CAM age, MAM age, FMM age…. Can I just have an age please?

A luminescence age from a sample is typically calculated from a distribution of ages measured from multiple individual grains or multi-grain aliquots from that sample. The age (or De) distribution of samples where all of the grains have been sufficiently exposed to sunlight to deplete their signal prior to final deposition will be tightly clustered around a single value (assuming minimal or no grain-to-grain variations in environmental dose rate). Those samples where many grains contain a residual, unbleached signal, on the other hand, will exhibit a much more broad, or skewed age distribution. In this latter case, a calculated mean or average age will over-estimate the true age (or time of final deposition) of the deposit.

The Central Age Model (or CAM) is a statistical model typically used to calculate the age from De distributions in samples that have been well-bleached prior to deposition. If this model is applied to samples of several hundred years in age or older, it is typically applied to log-transformed De values to take into account the fact that the De standard errors typically increase with the size of the De estimates. When it is applied to very young, or modern samples, where no strong correlation between De values and their standard errors exist however, it is typically applied to unlogged data.

The CAM yields two parameters:

1)      the central dose (δ), which is essentially the geometric mean of the De distribution, and

2)      and the overdispersion (σ), or the relative standard deviation of this distribution.

The overdispersion parameter represents the “spread” in the De distribution that remains after all measurement errors specific to each grain/aliquot (also known as the “within-aliquot variation”) have been taken into account. When σ is non-zero or high, we may infer that: i) some grains have been insufficiently bleached prior to deposition, ii) there has been mixing between sedimentary layers of different ages, and/or iii) there are grain-to-grain variations in environmental dose rate not taken into account in our dose rate estimate.

A multi-grain aliquot De distribution from a partially bleached sample collected below an intertidal indigenous clam garden wall on Quadra Island, BC, Canada (Neudorf et al., 2017). Grey shading in the radial plot marks ±2σ of the CAM De value (~5 k…

A multi-grain aliquot De distribution from a partially bleached sample collected below an intertidal indigenous clam garden wall on Quadra Island, BC, Canada (Neudorf et al., 2017). Grey shading in the radial plot marks ±2σ of the CAM De value (~5 ka), and the solid line marks the younger MAM De value (~4 ka). Click here for an explanation on how to read a radial plot.

The Minimum Age Model (or MAM) is typically applied to samples that are known to have received insufficient light exposure to re-set the luminescence signals in all grains prior to final deposition. This often occurs in colluvial or waterlain deposits. This model assumes that the true (log-transformed) De values are drawn from a truncated normal distribution, where the lower truncation point (γ) corresponds to the average true log De of the population of fully bleached grains.

The MAM yields four parameters:

1)      the minimum dose (γ), which corresponds to the minimum age of the deposit,

2)      the proportion (p) of grains/aliquots in the De distribution that comprise the minimum age,

3)      the mean (µ) and standard deviation (σ) of the truncated normal distribution from which the log-transformed De values are assumed to be derived.

The Finite Mixture Model (or FMM) is applied to samples with mixtures of grains derived from two or more sedimentary units of different ages. Sediment mixing can occur during soil forming processes, bioturbation, infilteration of finer grained material into coarser grained deposits, or human activities such as trampling, ploughing or digging. In these situations, the FMM is used to distinguish between individual De components in the distribution, the absolute number of which, is not always known a priori.

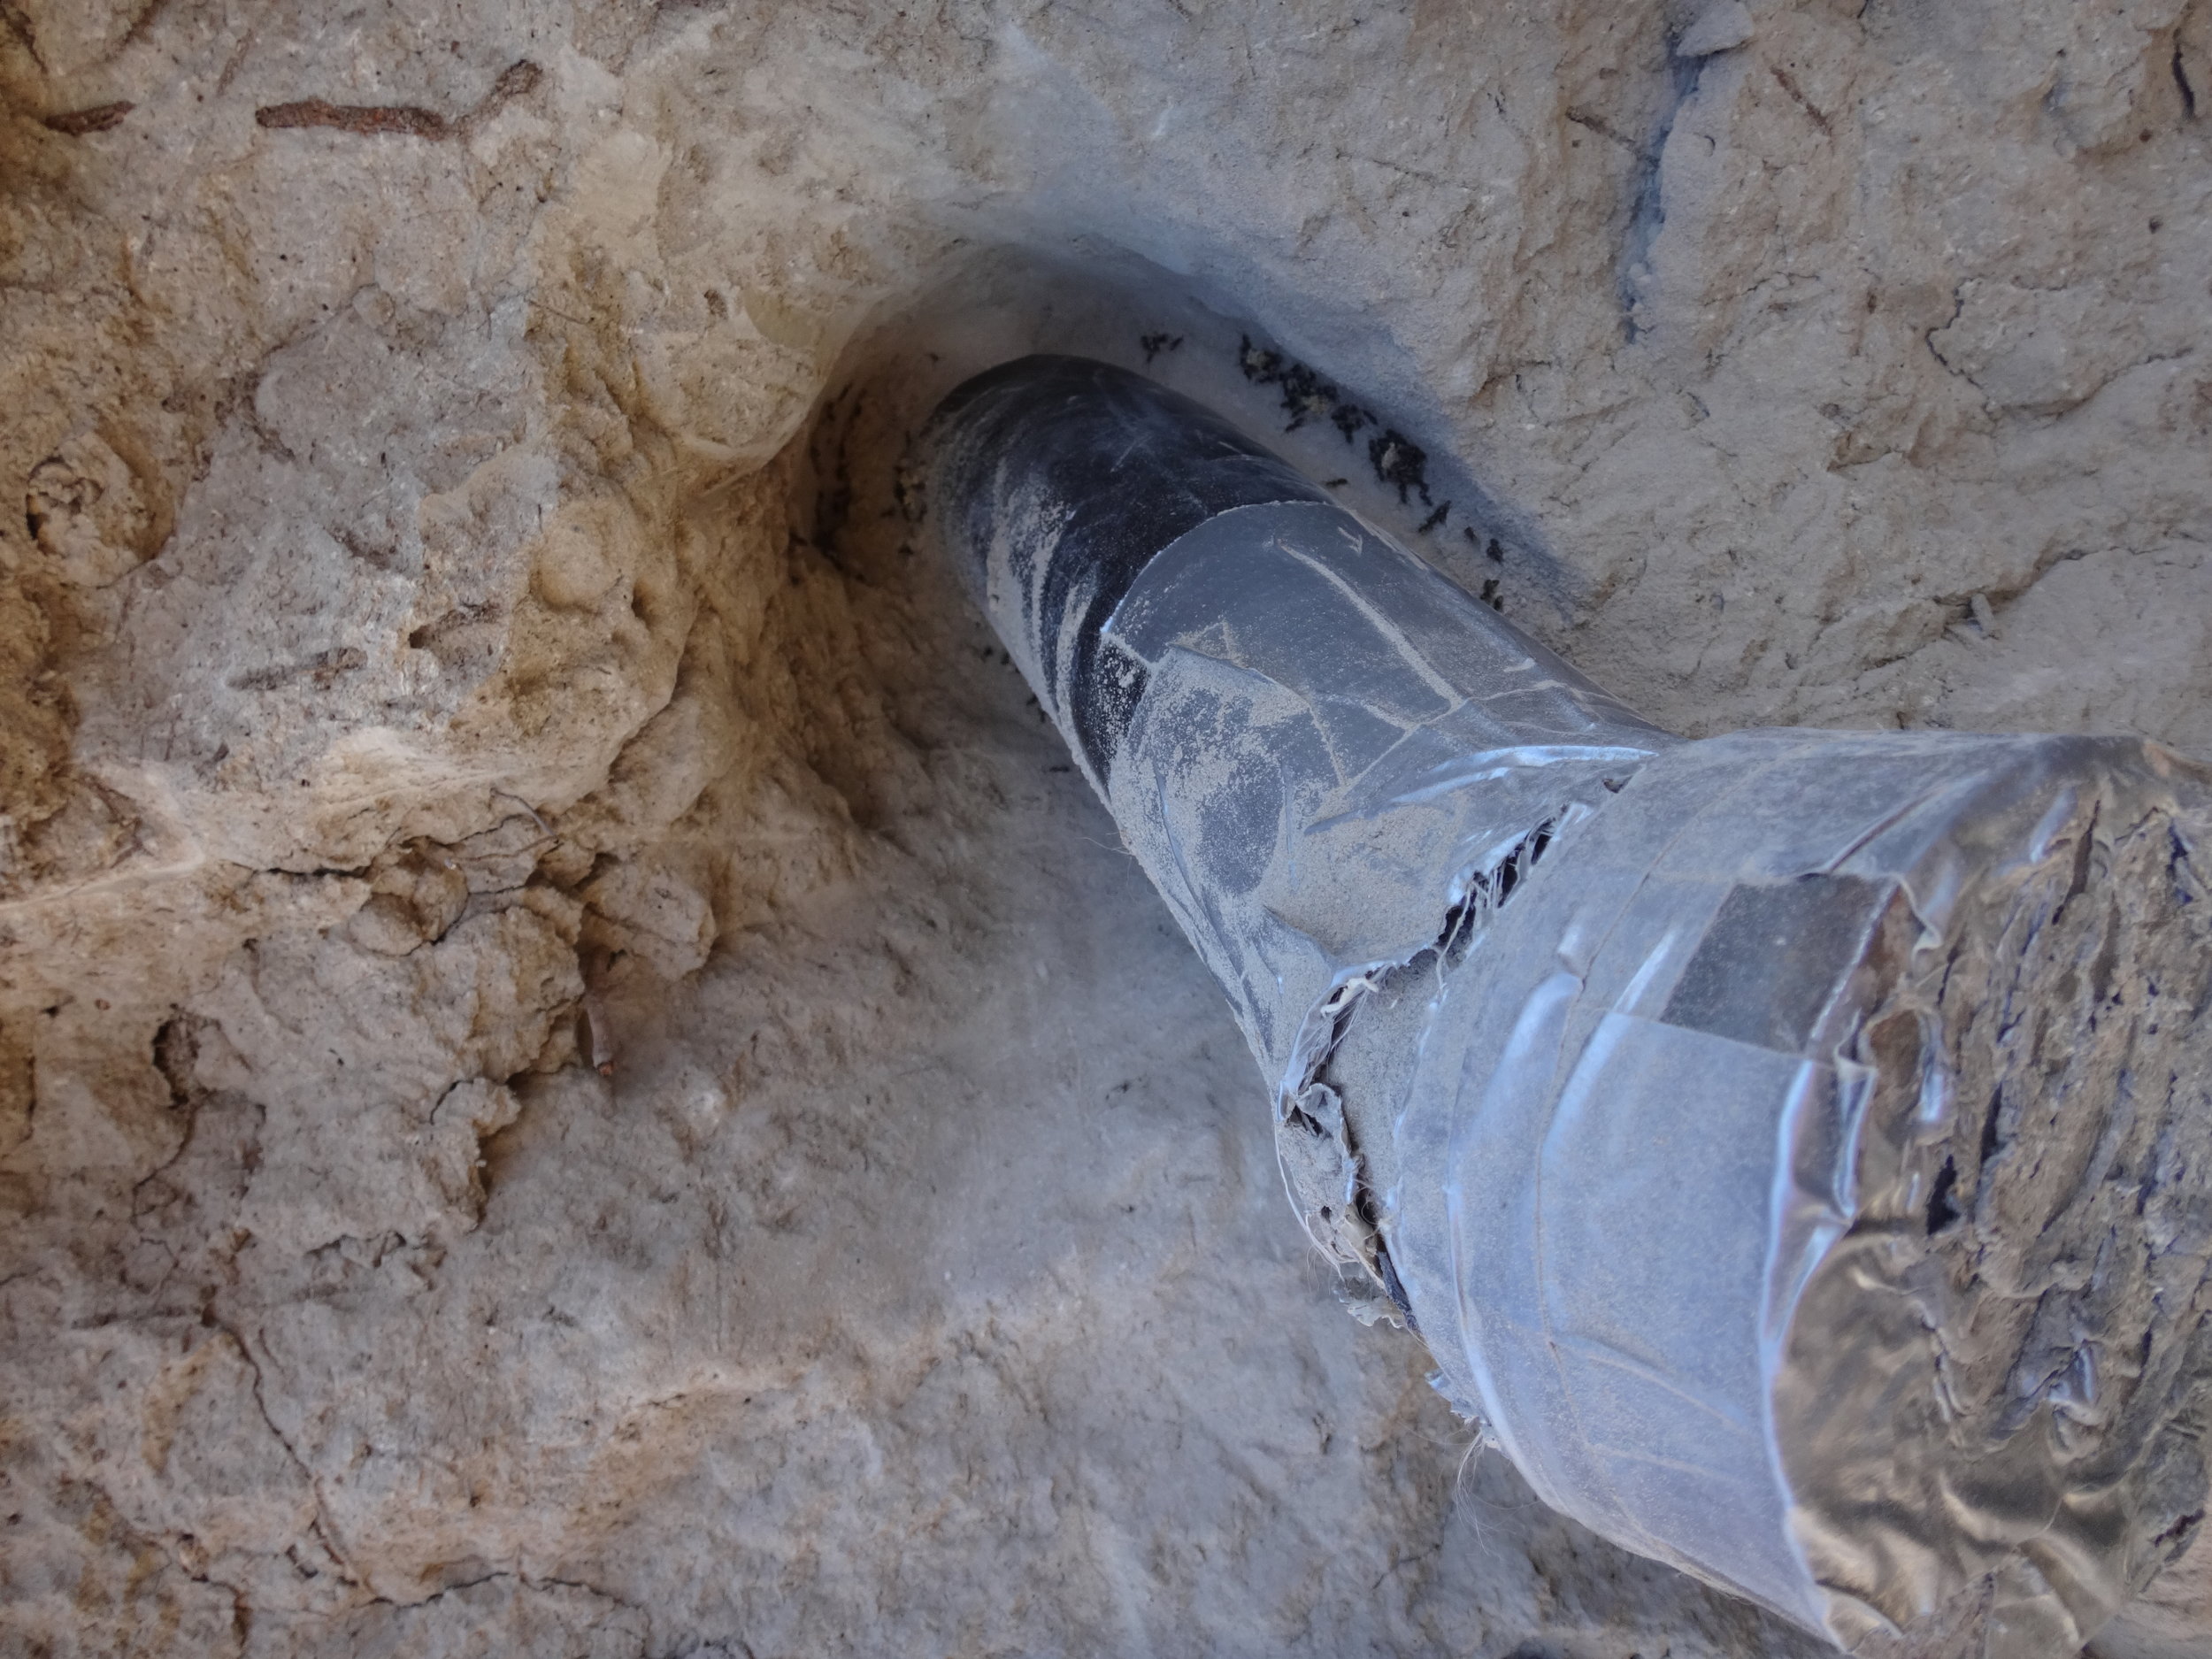
This OSL sample tube has intersected an ant burrow. Sediment mixing can occur when roots or insects burrow into the substrate, bringing recently sun-bleached grains from the surface down into older sedimentary units. Photo credit: Christina Neudorf

This OSL sample tube has intersected an ant burrow. Sediment mixing can occur when roots or insects burrow into the substrate, bringing recently sun-bleached grains from the surface down into older sedimentary units. Photo credit: Christina Neudorf

Application of the FMM to a De distrbution is an iterative process that determines:

1)      the number (k) of discrete De components in a distribution,

2)      the relative proportions of grains (π) in each component,

3)      and the mean (µ) and standard deviation (σ) of each component.

It is generally not advised to apply the FMM to multi-grain aliquot De distributions, as multi-grain aliquots may contain grains from more than one De component.  If the FMM is applied to multi-grain aliquot data, it may generate pseudo- or “phantom” De components with doses that fall between those of the true De components.

A single-grain (black dots) and multi-grain aliquot (white triangles) K-feldspar age distribution from a sample collected from alluvial sands in the Middle Son Valley, Andhra Pradesh, India (Neudorf et al.2014). The solid lines plot the ages of thre…

A single-grain (black dots) and multi-grain aliquot (white triangles) K-feldspar age distribution from a sample collected from alluvial sands in the Middle Son Valley, Andhra Pradesh, India (Neudorf et al.2014). The solid lines plot the ages of three FMM age components detected in the single-grain data that are interpreted to represent a mixture of older cutbank deposits and younger fluvial sands. The youngest (third) component is interpreted to represent bioturbation as roots penetrating overlying soils translocate grains from the surface down to the sample site. The shaded region marks ±2σ of the MAM De value calculated from the multi-grain aliquot data. Click here for an explanation on how to read a radial plot.

Single-grain vs multi-grain analysis – which one should I use?

Luminescence dating measurements can be made on multi-grain aliquots of sand adhered to stainless steel or aluminum discs, or on individual sand grains mounted on single-grain discs with holes of up to 300 µm in diameter. There are two main advantages of single-grain analysis:

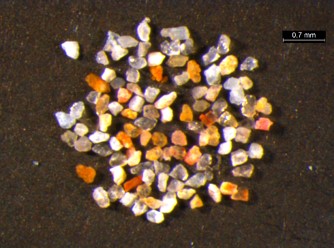
A quartz grain (TOP), a quartz multi-grain aliquot (BOTTOM LEFT), and a K-feldspar-rich multi-grain aliquot (BOTTOM RIGHT) extracted from alluvial sand from the Middle Son Valley, Madhya Pradesh, India. Photo credits: Christina Neudorf

A quartz grain (TOP), a quartz multi-grain aliquot (BOTTOM LEFT), and a K-feldspar-rich multi-grain aliquot (BOTTOM RIGHT) extracted from alluvial sand from the Middle Son Valley, Madhya Pradesh, India. Photo credits: Christina Neudorf

1) grains with undesirable luminescence properties can be identified and disregarded from analysis, and

2)  the age (or De) distribution shape and structure is easier to visualize when luminescence signals are not comprised of multiple signals from multiple grains.

Grains that should be disregarded from analysis include those with optical properties not suitable for dating, or contaminating grains of a different mineral (feldspar grains in a quartz aliquot, for example). When dating K-feldspar at the single-grain scale, grains that suffer from anomalous fading can also be excluded, so that corrections for this effect do not have to made later.

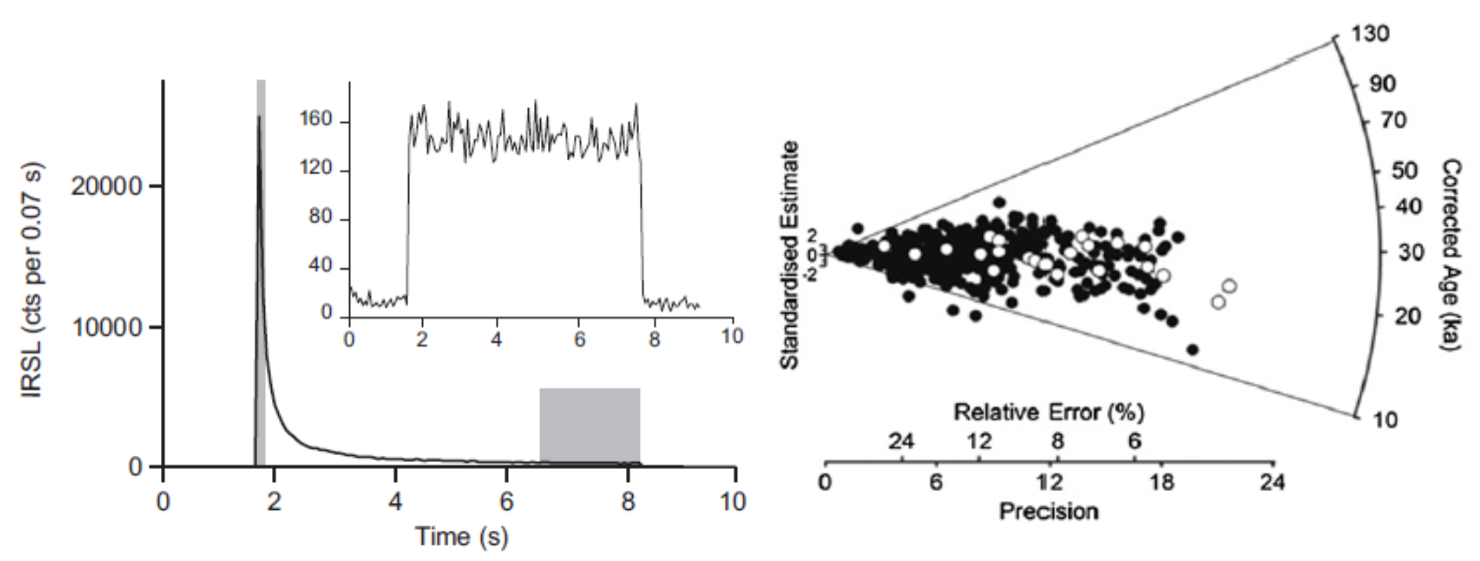
(LEFT) The luminescence signal (measured in photon counts per 0.07 s) from a K-feldspar grain and a contaminating quartz grain (inset) detected through CN 7-59 and BG 39 optical filters (from Neudorf et al. 2012). (RIGHT) A multi-grain K-rich feldsp…

(LEFT) The luminescence signal (measured in photon counts per 0.07 s) from a K-feldspar grain and a contaminating quartz grain (inset) detected through CN 7-59 and BG 39 optical filters (from Neudorf et al. 2012). (RIGHT) A multi-grain K-rich feldspar aliquot age distribution (white symbols) superimposed on a single-grain K-feldspar age distribution (solid symbols) from the same sample (from Neudorf et al. 2012). Note the averaging effect of the multi-grain distribution. Click here for instructions on how to read a radial plot.

Single-grain analysis also allows geochronologists to assess how well a sample has been bleached by the sun prior to burial. In many depositional environments, grain signals may only be partially depleted, or not at all due to turbid subaqueous conditions, or rapid deposition by gravity or water. This can lead to a highly spread or skewed De distribution, where the true age of the deposit must be calculated from the youngest grains only.

In some instances, single grain analysis can also reveal evidence of mixing between two or more deposits of different age. In these cases, statistical models may be applied to help distinguish one component from another.

(TOP LEFT) A highly spread multi-grain K-feldspar aliquot De distribution from partially bleached littoral sands near Great Slave Lake, NWT, Canada (Wolfe et al. 2018). Each aliquot consisted of ~100 grains. (TOP RIGHT) A multi-grain K-feldspar aliq…

(TOP LEFT) A highly spread multi-grain K-feldspar aliquot De distribution from partially bleached littoral sands near Great Slave Lake, NWT, Canada (Wolfe et al. 2018). Each aliquot consisted of ~100 grains. (TOP RIGHT) A multi-grain K-feldspar aliquot De distribution from coarse, subaqueous outwash fan deposits in north-central Quebec, Canada (Price et al. unpublished). The small spread suggests that the grain signals were re-set during transport in a shallow, proglacial stream prior to subaqueous deposition. Each aliquot consisted of ~70-100 grains. (BOTTOM LEFT) A multi-grain K-feldspar aliquot age distribution from well-bleached, terraced alluvial sands in the Middle Son Valley, India (Neudorf et al. 2014). Each aliquot consisted of ~30 grains. (BOTTOM RIGHT) A single grain quartz age distribution from alluvial sands in the Middle Son Valley, India underlying ash from the ~75 ka Toba supervolcanic eruption. The multi-grain K-feldspar aliquot age distribution (~30 grains per aliquot) from the same sample is shown as white triangles. Three solid lines mark the ages of three statistically significant components that may represent different aged sedimentary units that have been mixed during mass wasting and fluvial processes (Neudorf et al. 2014). Click here for instructions on how to read a radial plot

Of course, single-grain dating does have its disadvantages – first, measurements are much more time consuming, and second, measurement errors from individual grains tend to be higher than those from aliquots. If the sample of interest is derived from a depositional environment where partial bleaching is unlikely (sand dunes, for instance), it may be more time and cost efficient to measure multi-grain aliquots.

How to read Radial Plots

To obtain a luminescence age, geochronologists must first measure the equivalent dose or De value (an estimate of the amount of radiation absorbed by the sample in its burial environment). In most cases, the De for a sample is calculated from a distribution of De values measured from multiple aliquots or multiple grains from the same sample.

The De distribution allows us to assess a number of things, such as whether all grains have been sufficiently exposed to sunlight prior to the most recent burial event, or whether there has been mixing between two or more sedimentary units of different ages.

A radial plot. 95% of points should fall in grey shaded area if they are consistent with each other at 2 σ. The relative error is equal to the reciprocal of the precision.

A radial plot. 95% of points should fall in grey shaded area if they are consistent with each other at 2 σ. The relative error is equal to the reciprocal of the precision.

We commonly plot the De distribution in a radial plot. This allows us to see the magnitude of each De value as well as its error.

So, why not use a histogram?

A histogram would be appropriate if the De value errors were all the same. As it turns out, the error of a measured De value tends to be dependent on its magnitude, where larger De values have larger error. So De distributions are usually plotted on radial plots with a logarithmic scale on the radial axis. Unlogged scales may only be used on very young or modern samples with near-zero De values, where the dependency between De values and their errors tends to be negligible.

How to read a radial plot (modified from Galbraith and Roberts, 2012). On the left is the 2 sigma error. The width of the bar on the left is controlled by the distribution of De. The bottom scale indicates a measure of the error of each De measureme…

How to read a radial plot (modified from Galbraith and Roberts, 2012). On the left is the 2 sigma error. The width of the bar on the left is controlled by the distribution of De. The bottom scale indicates a measure of the error of each De measurement. The relative error and precision of each point (De value) can be read off of the bottom scale that is plotted on a regular orthogonal x,y coordinate system. The De value of each point can be read off of the radial axis on the right. The measured burial dose that is modeled from the population of De values is also typically plotted.

Recently scholars have argued for the use of a so-called “Abanico plot”. These plots combine the radial plot with a histogram or other univariate plot type, such as a kernel density estimate. An example of this type of plot is shown below for a De distribution with low-precision (<5) values and a small cluster of points below the mean (Component 2). Note that the two clusters are visible in the radial plot and kernel density estimate (blue), but become masked in the histogram (black).

A De distribution containing low-precision values and two components plotted in an Abanico plot. See Dietz et al. (2016) for more details on abanico plots and Galbraith and Roberts (2012) for more indepth discussion on radial plots, kernel density e…

A De distribution containing low-precision values and two components plotted in an Abanico plot. See Dietz et al. (2016) for more details on abanico plots and Galbraith and Roberts (2012) for more indepth discussion on radial plots, kernel density estimates and other data visualization strategies.

Paleodose and equivalent dose… what’s the difference?

In the scientific literature, OSL geochronologists commonly report an “equivalent dose” with units of Gray (also known as the De value) as well as an age for a sample. So, if we need to know the “paleodose” of a sample to calculate its age, what is this “De value” all about?

The equivalent dose (or De value) is obtained through experimentation in the laboratory and is simply our attempt at estimating the true paleodose. We say “estimating” because the accuracy of our De value depends entirely on the robustness of our laboratory procedures and the luminescence characteristics of our sample. This is one reason that independent age control is important to verify ages in any geochronologic approach.

A comparison between radiocarbon and luminescence (IRSL) ages from peat and beach sand, respectively on Calvert Island, BC, Canada. Photo credit: Christina Neudorf.

A comparison between radiocarbon and luminescence (IRSL) ages from peat and beach sand, respectively on Calvert Island, BC, Canada. Photo credit: Christina Neudorf.

There are several ways to measure the De value of a sample, but all methods involve measuring a samples’ response to radiation treatment in the lab. This requires measuring the luminescence intensity emitted by a sample after it is given a series of known laboratory doses.

Typical “dose response” or “regeneration curve”. The natural signal is shown as a small box on the y-axis. The De value is the corresponding value for the sample’s regeneration curve on the x-axis.

Typical “dose response” or “regeneration curve”. The natural signal is shown as a small box on the y-axis. The De value is the corresponding value for the sample’s regeneration curve on the x-axis.

OSL geochronologists plot a samples’ response to dose in a “dose response curve” or “regeneration curve”. We then measure the intensity of “natural signal” of the sample (i.e. the signal received in nature and obtained before the sample has received any kind of laboratory treatment). Where the natural signal falls on the dose response curve determines the value of the De. This is essentially a calibration method completed for each aliquot measurement. Multiple measurements of De are combined through statistical techniques to model the final paleodose value that is used in age calculation.

—Christina Neudorf

Quartz or Feldspar? Which mineral should I date?

Both quartz and feldspar are commonly used for luminescence dating. Which mineral is dated depends on its abundance in the sample, as well as its luminescence characteristics. Feldspar exists as a range of mineral species, but the one most commonly used in luminescence studies is potassium (K-) feldspar. All types of feldspar typically suffer from a phenomenon called “anomalous fading”, where the signal fades through geological time. The fading rate of each sample can be measured, however, and corrections can be made if the fading rate is not too high. Table 1 below summarizes advantages and disadvantages of both quartz and feldspar. Typically, for new sites, we don’t know which mineral will work better until we prepare and analyze the sample on a luminescence reader.

Table 1. Advantages and disadvantages of dating quartz and feldspar. Modified from Lian (2007).

Table 1. Advantages and disadvantages of dating quartz and feldspar. Modified from Lian (2007).

1. This applies to the most commonly used luminescence signals, blue stimulated luminescence (quartz) and infrared-stimulated luminescence (feldspar). More recent signals (e.g., violet stimulated or thermally-transferred luminescence signals) are be…

1. This applies to the most commonly used luminescence signals, blue stimulated luminescence (quartz) and infrared-stimulated luminescence (feldspar). More recent signals (e.g., violet stimulated or thermally-transferred luminescence signals) are being investigated as means of extending the dating range of luminescence dating techniques.

SHEDDING SOME LIGHT ON LUMINESCENCE DATING

Few have may have heard about luminescence dating despite the fact that it is now used almost routinely in archaeological and paleoclimate studies and can surpass the upper limit of radiocarbon dating by over a hundred thousand years! Over the last 40 years, luminescence dating has become an essential tool for helping us understand the timing of early human dispersal, climate change, sea level change, landscape evolution, and the rate of retreat of the last great ice sheets, among other things. This goal of this blog is to serve as a resource for students, academics, users of luminescence data and others who want to understand luminescence dating techniques and how to interpret luminescence age data.

Feb28-Mar05-09 618.jpg

What is OSL?

Optically stimulated luminescence dating

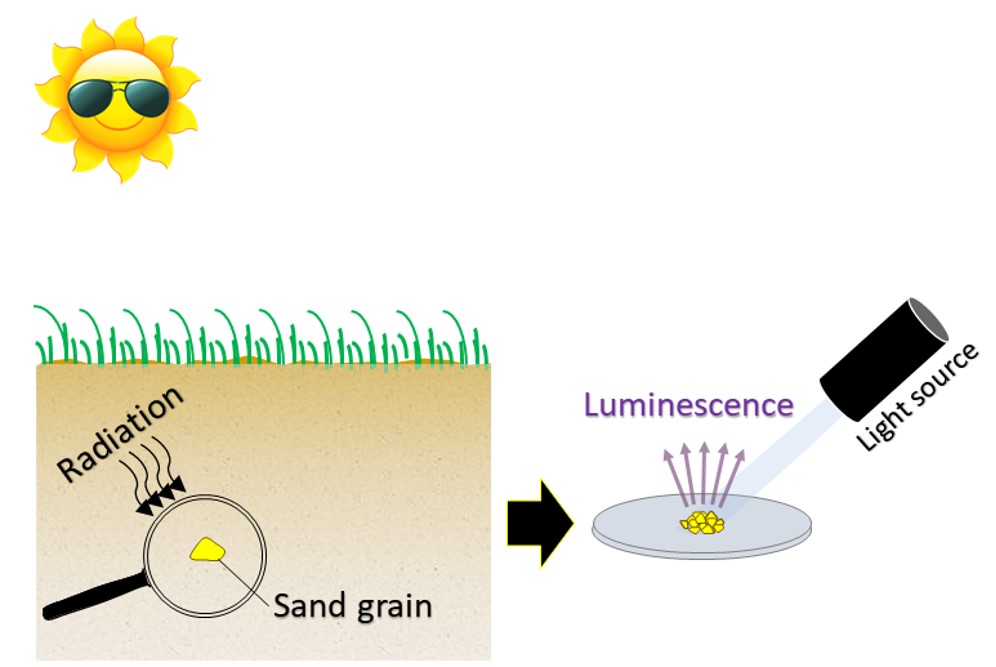
Optically stimulated luminescence broadly refers to a myriad of techniques that are used to determine that last time minerals (typically quartz or feldspar) were exposed to sunlight or heat. In the case of sunlight, luminescence ages tell us the approximate time a deposit or artifact was buried. After quartz and feldspar minerals are buried, they are exposed to ionizing radiation emitted from the surrounding sediments and cosmic rays from outer space that penetrate the ground surface.  At the molecular scale, this radiation re-mobilizes electrons, which in turn accumulate within defects (so-called “traps”) inside the crystal lattice. These defects exist in the form of structural imperfections or impurities. The longer the mineral is buried, the more electrons accumulate within the traps.

hourglass2.jpg

How do we obtain an OSL age?

To calculate an age, we need to define:

1)     the amount of radiation absorbed by the mineral during burial (also called the paleodose), and

2)     the rate at which the mineral was irradiated during burial (called the environmental dose rate).

The age is calculated as the paleodose divided by the environmental dose rate.

burial.jpg

To estimate the paleodose, the mineral is stimulated with a light source in the lab (blue or green light in the case of quartz), which evicts the electrons from their traps and results in the emission of photons of light (luminescence). The luminescence intensity (total photon counts) is measured by a photomultiplier tube and provides an estimate of the amount of radiation absorbed by the mineral during burial.

To measure the environmental dose rate, the quantity of radionuclides in the surrounding sediments are either measured directly, or estimated using radiation detectors in the field or in the lab.

Luminescence dating techniques are used to determine the age of artifacts, landforms and sediments that are as young as a few decades, to as old as ~ 1 Ma. This allows us to refine our understanding of Earth and human history during the Pleistocene and Holocene epochs.

Neolithic stone tools excavated from the Middle Son Valley, Madhya Pradesh, India, 2009. Photo credit: Christina Neudorf.

Neolithic stone tools excavated from the Middle Son Valley, Madhya Pradesh, India, 2009. Photo credit: Christina Neudorf.

The following blog posts will shed some light on the physics of luminescence dating, clarify commonly misunderstood concepts, provide guidance on how interpret luminescence dating data, include some handy tips for sampling in the field, and some links for further reading.

—Christina Neudorf